
Brent crude rose from $71 a barrel on 27 February 2026 to $130 on 8 October, according to the US Energy Information Administration (EIA). The IMF now expects global inflation of 4.7% this year, against the 3.8% it forecast in January before the war began.
The two wars hit prices through different channels. The 2022 Ukraine shock was mainly a gas and grain shock that landed hardest on Europe. The 2026 Iran shock is mainly an oil and fuel shock that is landing hardest on fuel importers in Asia, Africa and southern Europe, so the same country can sit at opposite ends of the two rankings.
This page covers oil, fuel, gas, food, shipping and consumer inflation for both wars, then ranks the countries hit hardest. Every figure links to the agency, central bank or statistics office that published it.
Top Picks
Oil and fuel
- Brent crude: $71.32 on 27 Feb 2026, $130.18 on 8 Oct 2026, up 83% (EIA)
- Oil exports disrupted at the peak of the Hormuz closure: nearly 20 million barrels a day, the largest disruption on record (IEA)
- US petrol: $2.94 a gallon before the war, $4.50 at the May peak, $4.28 on 19 October (EIA)
- US diesel: $3.81 before the war, a record $6.53 on 21 September (EIA)
- EU diesel: €1.59 a litre before the war, a record €2.24 on 28 September (European Commission)
Food and shipping
- FAO Food Price Index: 125.3 in February 2026, 136.0 in September, up 8.5% (FAO)
- Urea fertiliser: up 80% by April, back about 12% below its pre-war price by mid-September (World Bank, IMF)
- War-risk insurance for a Gulf transit: from 0.25% to as much as 10% of a ship’s value (FAO)
Inflation
- Global inflation 2026: 4.7%, against 3.8% forecast before the war (IMF)
- Euro area energy inflation: minus 3.1% in February 2026, plus 18.9% in September (Eurostat)
- US CPI: 2.4% in February, 3.7% in September; energy up 20.4% (BLS)
Hardest hit
- Iran: 89.8% year-on-year inflation in September 2026 †
- Qatar’s economy: forecast to grow 6.1% in 2026 before the war, now forecast to shrink 15.6% (IMF)
- Pakistan inflation: 7.0% in February, 11.7% in May (Pakistan Bureau of Statistics)
- Philippines inflation: 4.1% in March, 7.2% in April (Philippine Statistics Authority)
- Spain: from the second-lowest inflation in the EU in October 2022 to seventh-highest in the EU in September 2026 (Eurostat)
The 2022 comparison
- Inflation peaks after the Ukraine invasion: euro area 10.6%, UK 11.1%, US 9.1% (Eurostat, ONS, BLS)
- Prices are 28% higher in the UK than at the end of 2020, 24% in the US and 23% in the euro area (ONS, BLS, Eurostat)
How Much Has the 2026 Iran War Raised Oil Prices?
Brent crude rose from $71.32 a barrel on 27 February 2026, the last trading day before the war, to $130.18 on 8 October 2026, according to the EIA. That is an 83% rise, and within 3% of the 2022 peak of $133.18.
| Measure | Figure | Source (date) |
|---|---|---|
| Brent spot, last pre-war day | $71.32 (27 Feb 2026) | EIA daily spot prices (Oct 2026) |
| Brent front-month futures, end of Q1 | $118 (31 Mar 2026); above $100 from 12 Mar | EIA Today in Energy (Apr 2026) |
| Brent spot, 2026 high so far | $130.18 (8 Oct 2026) | EIA daily spot prices (Oct 2026) |
| North Sea Dated, September average | $116.89, up $26.17 on August | IEA Oil Market Report (14 Oct 2026) |
| WTI spot | $101.91 (14 Oct 2026) | EIA (Oct 2026) |
| EIA forecast, Brent average | $96 in 2026; $105 in Q4 2026; $84 in 2027 | EIA Short-Term Energy Outlook (6 Oct 2026) |
| IMF oil price assumption, 2026 | $95.74, up 41.3% on 2025 | IMF World Economic Outlook (13 Oct 2026) |
| IMF adverse scenario | Oil averages about $130 in 2027 if conflict runs to mid-2027 | IMF Regional Economic Outlook, Middle East and Central Asia (22 Oct 2026) |
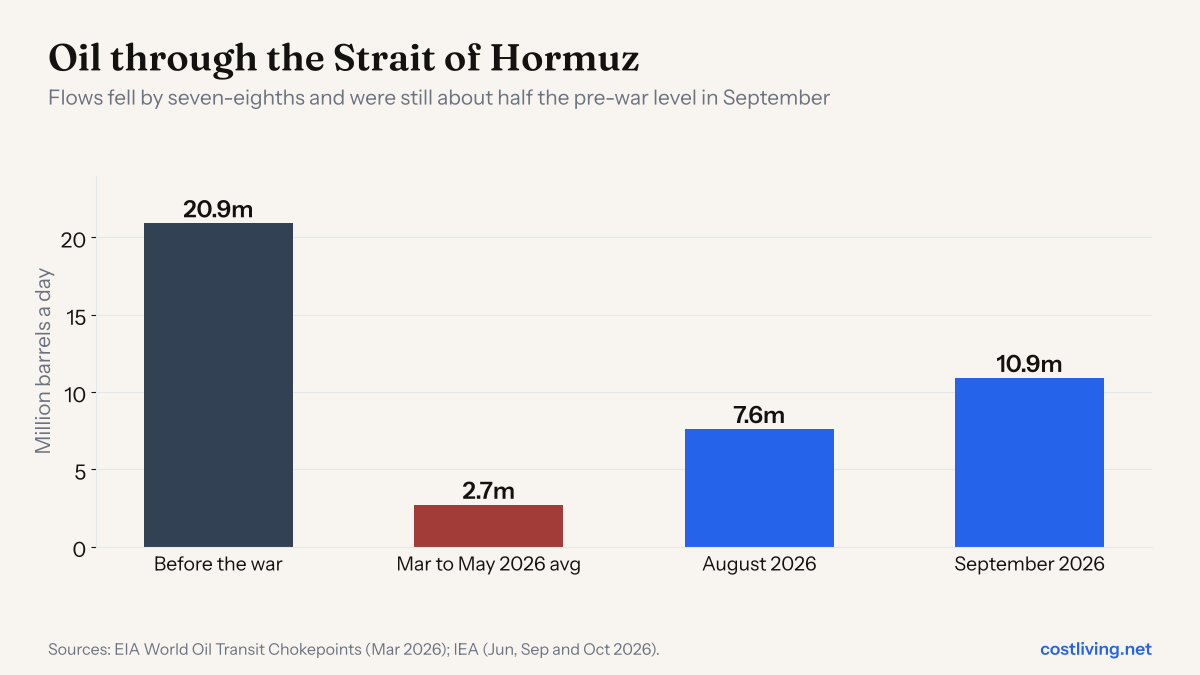
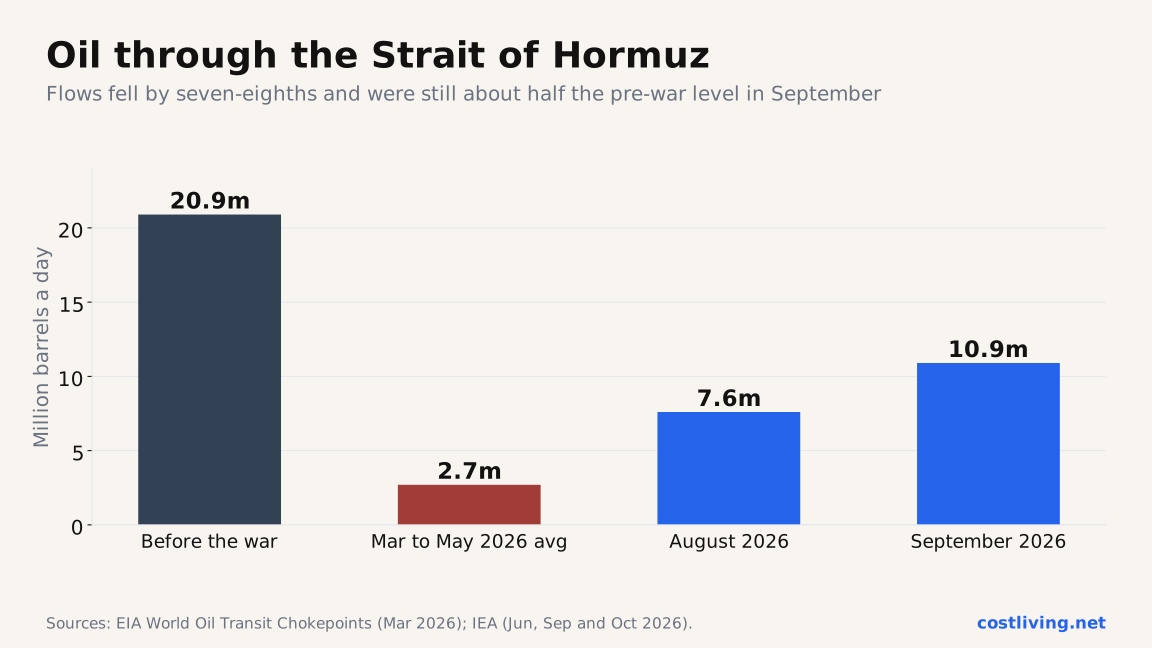
The supply loss behind those prices was the largest ever recorded. About 20.9 million barrels a day moved through the Strait of Hormuz before the war, roughly a fifth of world consumption, according to the EIA. The IEA called the March disruption “the largest supply disruption in the history of the global oil market”.
| Measure | Figure | Source (date) |
|---|---|---|
| Oil through Hormuz before the war | 20.9 million b/d, about 20% of global consumption | EIA World Oil Transit Chokepoints (3 Mar 2026) |
| Exports disrupted at the peak | Nearly 20 million b/d | IEA Oil Market Report (12 Mar 2026) |
| Hormuz flows, March to May average | 2.7 million b/d | IEA (22 Jun 2026) |
| Hormuz flows, August | 7.6 million b/d | IEA (18 Sep 2026) |
| Hormuz flows, September | 10.9 million b/d | IEA Oil Market Report (14 Oct 2026) |
| Cumulative export losses by mid-September | Approaching 2.8 billion barrels | IEA (18 Sep 2026) |
| Emergency stocks released | 400 million barrels, the largest IEA action ever | IEA (11 Mar 2026) |
| Gulf exporters’ oil and gas output | 33 million b/d in February to close to 19 million in May; Qatar down by up to 86% | IMF Regional Economic Outlook (22 Oct 2026) |
Our working: 2.8 billion barrels lost against world demand of about 102 million barrels a day (IEA, October 2026) is about 27 days of global consumption that never arrived. September flows were still only about half the pre-war level.
Prices rose less than the supply loss alone would suggest. The IMF counts 1.8 billion barrels of cumulative losses by July, more than in 1973 or 1990, and credits four offsets: a pre-war surplus of about 2.1 million barrels a day, about 280 million extra barrels from producers outside the Gulf, 750 million barrels of lost demand, and about 440 million barrels drawn from inventories. The IEA’s 2.8 billion runs to mid-September and counts export losses, so the two figures measure different things.
Refined fuels rose much faster than crude. Between late February and mid-September, jet fuel rose about 85%, diesel 68% and petrol 45%, with refining margins at a historic high, according to the IMF.
How Much More Are Drivers Paying at the Pump?
US regular petrol averaged $2.94 a gallon in the week of 23 February 2026 and $4.50 at its peak in the week of 11 May, according to the EIA. On 19 October it was $4.28, still 46% above the pre-war price.
| Market | Before the war | 2026 peak | Latest | Source (date) |
|---|---|---|---|---|
| US regular petrol, $/gallon | 2.937 (23 Feb) | 4.500 (11 May) | 4.284 (19 Oct) | EIA weekly retail prices (20 Oct 2026) |
| US diesel, $/gallon | 3.809 (23 Feb) | 6.529 (21 Sep), above the June 2022 record of 5.810 | 6.276 (19 Oct) | EIA weekly retail prices (20 Oct 2026) |
| EU average petrol, €/litre | 1.637 (23 Feb) | 2.104 (28 Sep, series record) | 1.991 (19 Oct) | European Commission Weekly Oil Bulletin (Oct 2026) |
| EU average diesel, €/litre | 1.594 (23 Feb) | 2.237 (28 Sep, series record) | 2.139 (19 Oct) | European Commission Weekly Oil Bulletin (Oct 2026) |
| Spain diesel, €/litre | 1.423 (23 Feb) | 1.934 (28 Sep) | 1.889 (19 Oct) | European Commission Weekly Oil Bulletin (Oct 2026) |
| Portugal diesel, €/litre | 1.600 (23 Feb) | 2.210 (21 Sep) | 2.175 (19 Oct) | European Commission Weekly Oil Bulletin (Oct 2026) |
| Ireland diesel, €/litre | 1.737 (23 Feb) | 2.178 (30 Mar) | 2.137 (19 Oct) | European Commission Weekly Oil Bulletin (Oct 2026) |
| UK petrol, p/litre | About 130 (Feb) | 174.9 (5 Oct) | 174.9 (5 Oct) | Bank of England (17 Sep 2026); House of Commons Library (6 Oct 2026) |
| UK diesel, p/litre | About 140 (Feb) | 199.5 (5 Oct, record) | 199.5 (5 Oct) | Bank of England (17 Sep 2026); House of Commons Library (6 Oct 2026) |
Our working: US diesel rose 71% from 23 February to its September peak, and EU diesel 40% to its peak. Filling a 15-gallon tank with US regular costs about $20 more than before the war; filling a 55-litre diesel tank in the UK cost about £33 more in early October than in February.
EU prices include all taxes, and several governments cut fuel duties during the year, so the pre-tax rise is larger. Spain’s statistics office says its September fuel inflation would have been 36.4% at constant tax rates instead of the 27.7% recorded.
Which US states have seen the biggest petrol price rises?
Petrol in the Rocky Mountain region rose 68% between 23 February and 19 October 2026, the biggest rise of any US region, according to the EIA. California has the highest price at $6.03 a gallon, but the smallest percentage rise among the larger states because it started from $4.44.
| State or region | 23 Feb 2026 | 2026 peak (week) | 19 Oct 2026 | Change since 23 Feb |
|---|---|---|---|---|
| US average | $2.937 | $4.500 (11 May) | $4.284 | +45.9% |
| Rocky Mountain (PADD 4) | $2.662 | $4.587 (18 May) | $4.468 | +67.8% |
| Colorado | $2.578 | $4.618 (18 May) | $4.274 | +65.8% |
| Minnesota | $2.661 | $4.344 (18 May) | $4.180 | +57.1% |
| Midwest (PADD 2) | $2.675 | $4.405 (11 May) | $4.145 | +55.0% |
| Gulf Coast (PADD 3) | $2.532 | $3.989 (25 May) | $3.784 | +49.4% |
| New York | $2.889 | $4.522 (18 May) | $4.313 | +49.3% |
| Massachusetts | $2.845 | $4.448 (18 May) | $4.202 | +47.7% |
| Texas | $2.534 | $3.956 (25 May) | $3.704 | +46.2% |
| East Coast (PADD 1) | $2.834 | $4.336 (11 May) | $4.064 | +43.4% |
| Florida | $2.819 | $4.305 (11 May) | $3.981 | +41.2% |
| Ohio | $2.887 | $4.776 (4 May) | $4.049 | +40.2% |
| California | $4.441 | $6.227 (5 Oct) | $6.031 | +35.8% |
| West Coast (PADD 5) | $4.111 | $5.727 (5 Oct) | $5.557 | +35.2% |
| Washington | $4.143 | $5.595 (11 May) | $5.332 | +28.7% |
Source: EIA weekly retail gasoline prices, regular, all formulations (20 Oct 2026). Change is our calculation.
West Coast prices rose about as much in cents as everywhere else (California up $1.59, against $1.35 for the US average) but less in percentage terms because they started higher. California and the West Coast set their 2026 highs in early October, not May. Two baselines fall on unusual weeks: Ohio’s 23 February price was a one-week spike, which understates its rise, and Colorado’s was a one-week dip, which overstates it.
What Has the War Done to Gas and Electricity Bills?
European gas prices rose about 70% week on week after the first strikes, according to the EU energy regulator ACER, and by September were about 150% above pre-conflict levels, according to the IMF. That is still well below the 2022 peak.
| Measure | Figure | Source (date) |
|---|---|---|
| TTF gas price, week of the first strikes | Up about 70% week on week | ACER (23 Apr 2026) |
| Qatar LNG export capacity knocked out at Ras Laffan | About 17% of global LNG capacity | ACER (23 Apr 2026); IMF (16 Apr 2026) |
| EU gas storage, 1 April 2026 | 28% full | ACER (23 Apr 2026) |
| TTF, Q2 2026 average | Close to $16/MBtu, up 32% on a year earlier | IEA Gas Market Report Q3 2026 |
| Asian spot LNG (JKM), Q2 2026 average | $17.5/MBtu, up 45% | IEA Gas Market Report Q3 2026 |
| Qatar and UAE LNG supply lost in 2026 | About 54 to 55 bcm, down 45% | IEA Gas Market Report Q3 2026 |
| European gas, September 2026 | About 150% above pre-conflict levels, well below the 2022 peak | IMF Regional Economic Outlook (22 Oct 2026) |
| UK wholesale gas, 14 Sep 2026 | 207p/therm, up 78% since before July | Bank of England (17 Sep 2026) |
Household bills follow with a lag because of regulated tariffs. In Britain, Ofgem’s price cap has risen twice since the war began:
| Cap period | Typical annual dual-fuel bill | Change | Source (date) |
|---|---|---|---|
| April to June 2026 | £1,641 | Baseline | Ofgem |
| From 1 July 2026 | £1,663 on new typical-use figures (£1,862 on the old basis) | Up 13% like for like, about £18 a month | Ofgem (27 May 2026) |
| From 1 October 2026 | £1,723 | Up 4%, £60 a year | Ofgem (26 Aug 2026) |
Ofgem changed its assumed typical consumption in July, so £1,641 and £1,663 are not comparable. The 13% is Ofgem’s like-for-like figure.
Europe felt the gas shock through the global price rather than through lost cargoes. About 20% of the world’s LNG passes through Hormuz, but only about 7% of Europe’s LNG imports do, against 27% of Asia’s, according to the IEA. In 2022 the position was reversed: Russia supplied 45% of EU gas imports in 2021, and the cut-off hit Europe directly.
How Much More Expensive Has Food Become Since the Strait of Hormuz Closed?
The FAO Food Price Index rose from 125.3 points in February 2026 to 136.0 in September, up 8.5% in seven months, according to the UN Food and Agriculture Organization. September was the highest reading of 2026 but still 15% below the March 2022 record.
| Measure | Figure | Source (date) |
|---|---|---|
| FAO Food Price Index, February 2026 | 125.3 | FAO (6 Mar 2026) |
| FAO index, March 2026 | 128.5, up 2.4%; FAO cites higher energy costs linked to the conflict | FAO (3 Apr 2026) |
| FAO index, September 2026 | 136.0, up 5.8% on a year earlier; cereals 122.8, up 17.2% | FAO (2 Oct 2026) |
| Urea price, April 2026 | Above $850 a tonne, up 80% since February, highest since April 2022 | World Bank (14 May 2026) |
| Urea price, mid-September 2026 | About 12% below its 27 February level | IMF Regional Economic Outlook (22 Oct 2026) |
| Phosphate (DAP) and wheat, mid-September 2026 | Both up about 25% since 27 February | IMF Regional Economic Outlook (22 Oct 2026) |
| Sulphur price | Doubled since January | World Bank (14 May 2026) |
| World Bank fertiliser price index, 2026 forecast | Up 30.7% | World Bank Commodity Markets Outlook (Apr 2026) |
| Share of traded fertiliser through Hormuz | About one-third (World Bank, UNCTAD); up to 30% (FAO) | World Bank (Mar 2026); UNCTAD (10 Mar 2026); FAO (26 Mar 2026) |
| Gulf share of global sulphur exports | Over 40% | IMF (16 Apr 2026) |
| Countries with food inflation above 5%, Q1 2026 | About 50 of 149 | World Bank (27 Mar 2026) |
| IMF food price projection | Up 5% in 2026, 2.4% in 2027 | IMF (Oct 2026) |
The path from a closed strait to a dearer loaf runs through fertiliser and shipping. The urea spike has reversed, but phosphate stayed high because of export restrictions and the sulphur shortage. Wheat rose sharply from June, driven as much by Russia-Ukraine export disruption and weather as by the Gulf.
The hunger figures are scenarios, not counts. The World Food Programme warned in March that almost 45 million more people could fall into acute food insecurity if the conflict ran past mid-year with oil above $100. By June, the FAO and WFP counted around 266 million people facing high acute food insecurity across 13 hunger hotspots.
What Has Happened to Shipping and Insurance Costs?
Ship transits through the Strait of Hormuz fell by about 95%, according to UNCTAD, and war-risk insurance for a Gulf transit rose from 0.25% to as much as 10% of a vessel’s value, according to the FAO.
| Measure | Figure | Source (date) |
|---|---|---|
| Hormuz ship transits | Down about 95% | UNCTAD (28 Apr 2026) |
| War-risk premium, Gulf transit | From 0.25% to as much as 10% of vessel value, reset every 7 days | FAO (26 Mar 2026) |
| War-risk premium, July 2026 | 7.5% to 10% of hull value, against 1% to 3% before † | S&P Global data via Al Jazeera (23 Jul 2026) |
| Lloyd’s Joint War Committee | Bahrain, Kuwait, Oman, Qatar and Djibouti added to listed areas on 3 Mar 2026 | Lloyd’s Market Association, JWLA-033 |
| Drewry World Container Index | $2,279 per 40ft (26 Mar) †; $4,485 (15 Oct 2026) | Drewry via Daily Cargo News (Mar 2026); Drewry (15 Oct 2026) |
| Shanghai to Los Angeles | $7,884 per 40ft (15 Oct 2026) | Drewry (15 Oct 2026) |
| Transatlantic container rates | Up 50% in a week to more than $2,100 per FEU | Freightos (14 Apr 2026) |
| South Asia to Europe air cargo | Up 65% against end-February | Freightos (31 Mar 2026) |
Container rates roughly doubled between late March and mid-October, but tariffs and Suez routing also moved during the year, and Drewry attributes current rates to broad geopolitical uncertainty. Not all of the rise is down to Hormuz.
How Much Inflation Has the Iran War Added Worldwide?
The IMF expects global inflation of 4.7% in 2026, against the 3.8% it forecast in January before the war, and calls the conflict a “war-induced negative supply shock”. It expects world growth of 3.1% this year, down from 3.3% in January.
| Measure | Figure | Source (date) |
|---|---|---|
| Global inflation 2026, pre-war forecast | 3.8% | IMF WEO Update (19 Jan 2026) |
| Global inflation 2026, latest forecast | 4.7% (2025: 4.1%; 2027: 4.1%) | IMF WEO (13 Oct 2026) |
| Global growth 2026 | 3.1%, against 3.3% forecast in January | IMF WEO (13 Oct 2026); IMF WEO Update (19 Jan 2026) |
| Global growth 2026 (World Bank) | 2.5%, lowest since the pandemic | World Bank Global Economic Prospects (Jun 2026) |
| G20 inflation 2026 | 4.0% (2025: 3.4%) | OECD Economic Outlook (3 Jun 2026) |
| US scenario | A one-quarter Hormuz closure adds 0.6 points to headline PCE inflation; three quarters add 1.1 | Dallas Fed (17 Apr 2026) |
| Euro area | 3.0% in 2026, peaking at 3.6% in Q4; ECB deposit rate raised to 2.50% | ECB (10 Sep 2026) |
| UK | About 0.7 of the 1.1 points of CPI above target is the direct effect of energy prices | Bank of England (17 Sep 2026) |
The pass-through shows clearly in the monthly data:
| Economy | February 2026 | Latest | Energy, latest | Source (date) |
|---|---|---|---|---|
| OECD | 3.4% | 4.3% (Aug) | 13.6% (peak 15.7% in May; minus 0.5% in Feb) | OECD (6 Oct 2026) |
| G7 | 2.1% | 3.1% (Aug) | 14.0% | OECD (6 Oct 2026) |
| Euro area (HICP) | 1.9% | 3.8% (Sep) | 18.9%, contributing 1.71 points | Eurostat (16 Oct 2026) |
| United States (CPI) | 2.4% | 3.7% (Sep) | 20.4%; petrol 34.2%; fuel oil 74.2% | BLS (14 Oct 2026) |
| United Kingdom (CPI) | 3.0% | 3.5% (Sep) | Motor fuels 29.8% | ONS (21 Oct 2026) |
| Spain (CPI) | 2.3% | 4.9% (Sep), highest since Feb 2023 | Energy 21.7%; fuels 27.7% | INE (14 Oct 2026) |
| Portugal (CPI) | n/a | 3.6% (Sep) | Energy 15.3% | INE Portugal (13 Oct 2026) |
| Greece (CPI) | n/a | 5.0% (Sep) | Housing and energy 14.7% | ELSTAT (9 Oct 2026) |
| Japan (CPI) | n/a | 1.9% (Aug) | Energy minus 0.7% | Statistics Bureau of Japan (Sep 2026) |
Energy inflation was in double digits in August in every G7 country except Japan, which has been subsidising fuel. OECD food inflation, by contrast, fell to 2.8%, its lowest since July 2021: in rich countries this is so far an energy shock, not a food shock. In the US, March 2026 brought the biggest one-month petrol rise in the CPI series, 21.2%.
Which Countries Have Been Hit Hardest by the Iran War?
Iran itself is worst affected: inflation reached 89.8% year on year in September 2026, according to the Statistical Centre of Iran †, and the IMF projects 78.6% for the year, second only to Venezuela. Among fuel importers, Pakistan’s inflation rose from 7.0% in February to 11.7% in May and the Philippines’ from 4.1% in March to 7.2% in April.
| Country | Before the war | After | Driver | Source (date) |
|---|---|---|---|---|
| Iran | 50.6% (2025 average) | 89.8% y/y Sep 2026 †; 78.6% 2026 average (IMF) | Currency, war damage, sanctions | Statistical Centre of Iran via IranWire (1 Oct 2026); IMF WEO (Oct 2026) |
| Pakistan | 7.0% (Feb) | 11.7% (May); 11.1% (Aug) | Transport up 36.8%; urban motor fuel up 51.9% (May) | Pakistan Bureau of Statistics (May 2026); IMF REO (22 Oct 2026) |
| Philippines | 4.1% (Mar) | 7.2% (Apr) | Transport up 21.4%; rice up 13.7%; national energy emergency declared 24 Mar | Philippine Statistics Authority (5 May 2026) |
| Sri Lanka | 2.2% (Mar) | 5.4% (Apr) | Central bank cites “spillovers from the ongoing war in the Middle East” | Central Bank of Sri Lanka (30 Apr 2026) |
| Turkey | 30.9% (Mar) | 32.4% (Apr) | Energy up 14.4% in one month | Central Bank of the Republic of Türkiye (5 May 2026) |
| Kenya | 5.6% (Apr) | 6.7% (May) | Transport up 16.5%; Nairobi diesel up 41.2% y/y | Kenya National Bureau of Statistics (29 May 2026) |
| Bangladesh | 9.13% (Feb) † | 9.42% peak (May) †; 8.34% (Sep) | Fuel rationing from 6 March † | Bangladesh Bank (Sep 2026); BBS via The Business Standard † |
| India | 3.21% (Feb) | 4.38% (Jun) | Administered fuel prices muted the pass-through | MoSPI (13 Jul 2026) |
| Egypt | n/a | 14.5% (Aug) | Food, energy and currency depreciation | IMF REO (22 Oct 2026) |
| Lebanon | n/a | About 17% (latest) | Highest among the region’s oil importers | IMF REO (22 Oct 2026) |
| Qatar | 0.6% (2025 average) | 3.6% (2026, IMF projection); food and beverages up 10.4% (Apr) † | Food imports disrupted | IMF WEO (Oct 2026); National Planning Council via QNA (18 May 2026) † |
| Spain (CPI) | 2.3% (Feb) | 4.9% (Sep) | Fuels up 27.7% | INE (14 Oct 2026) |
| Greece (CPI) | 1.9% (Sep 2025) | 5.0% (Sep 2026) | Housing and energy up 14.7% | ELSTAT (9 Oct 2026) |
Which economies have shrunk the most?
The Gulf’s own economies are shrinking even as their export prices soar, because the oil cannot leave. The IMF expects Qatar’s economy to shrink 15.6% in 2026, against the 6.1% growth it forecast before the war, and the Middle East, North Africa, Afghanistan and Pakistan region (MENAP) to shrink 1.3%.
| Economy | 2026 forecast before the war (Oct 2025) | Apr 2026 (six weeks into the war) | Oct 2026 | Change since before the war | 2027 forecast |
|---|---|---|---|---|---|
| MENAP | 3.7% | 1.4% | -1.3% | -5.0 points | 6.6% |
| Gulf Cooperation Council | n/a | 2.0% | -4.8% | n/a | 9.1% |
| Qatar | 6.1% | -8.6% | -15.6% | -21.7 points | 18.8% |
| Kuwait | 3.9% | -0.6% | -16.7% | -20.6 points | 17.1% |
| Iraq | 3.6% | -6.8% | -16.0% | -19.6 points | 19.0% |
| Bahrain | 3.3% | -0.5% | -11.3% | -14.6 points | 13.9% |
| UAE | 5.0% | 3.1% | -3.9% | -8.9 points | 7.7% |
| Iran | 1.1% | -6.1% | -7.6% | -8.7 points | 3.6% |
| Saudi Arabia | 4.0% | 3.1% | -3.3% | -7.3 points | 7.9% |
| Oman | 4.0% | 3.5% | 4.1% | +0.1 points | 2.2% |
| Egypt | 4.5% | 4.2% | 5.1% | +0.6 points | 4.7% |
| Pakistan | 3.6% | 3.6% | 3.6% | 0.0 | 3.5% |
Source: IMF Regional Economic Outlook, Middle East and Central Asia, Table 1.2 (22 Oct 2026); pre-war column from IMF World Economic Outlook Statistical Appendix Table A4 (Oct 2025) and IMF MCD briefing (20 Oct 2025). Egypt, Iran and Pakistan are fiscal years. The IMF did not publish a pre-war GCC aggregate in the WEO.
Countries with no export route around Hormuz (Bahrain, Iraq, Kuwait, Qatar) were hit hardest. Saudi Arabia and the UAE were cushioned by pipelines, and Oman, outside the strait, is growing slightly faster than forecast. The IMF expects MENAP inflation to rise from 11.7% in 2025 to 13.8% in 2026, while subsidies, price controls and dollar pegs hold GCC inflation to 2.7%.
IMF 2026 inflation projections for popular destinations, 2025 in brackets: Philippines 5.6% (1.7%), Vietnam 4.7% (3.3%), UAE 4.5% (1.3%), Greece 4.2% (2.9%), Australia 3.9% (2.8%), Spain 3.7% (2.7%), US 3.6% (2.7%), UK 3.3% (3.4%), Portugal 3.2% (2.2%), euro area 3.1% (2.1%), Japan 2.0% (3.2%). These are annual averages; the IMF’s end-of-year figures are higher. For the UK, the annual average is slightly below 2025 because inflation was higher in early 2025, even though the Bank of England expects it to rise above 4% in early 2027.
Real pay is slipping again. The OECD reports that real statutory minimum wages fell 1.5% on average between January and April 2026, and that real wages in 13 of 37 OECD countries were still below their early-2021 level before this shock began.
Which EU Countries Have the Highest Inflation Now?
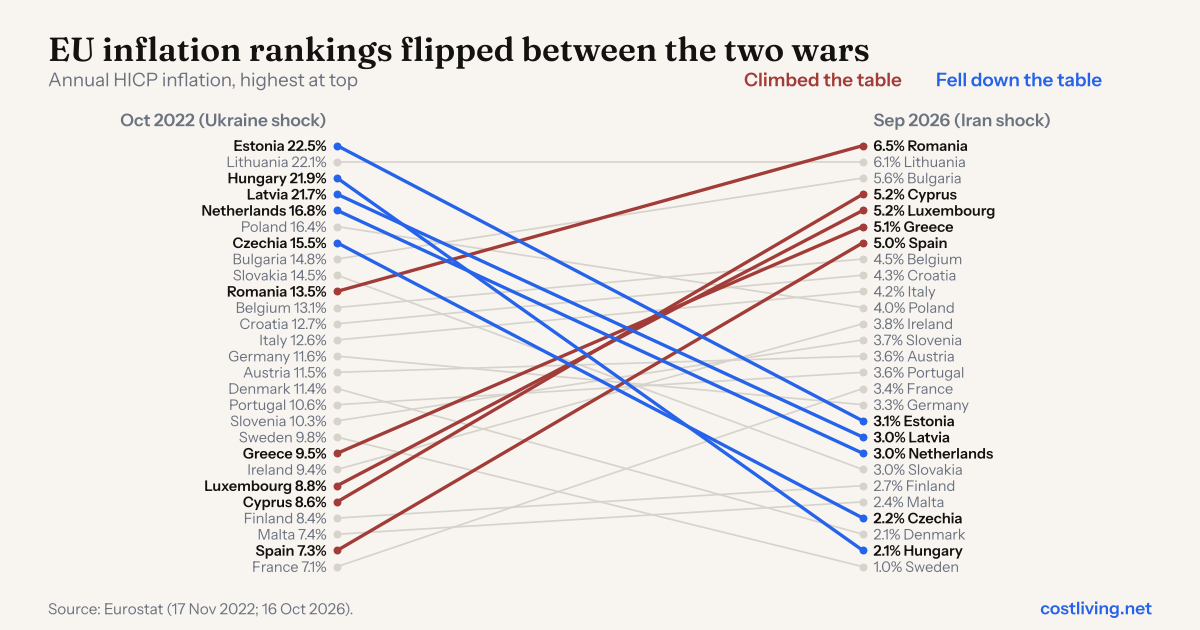
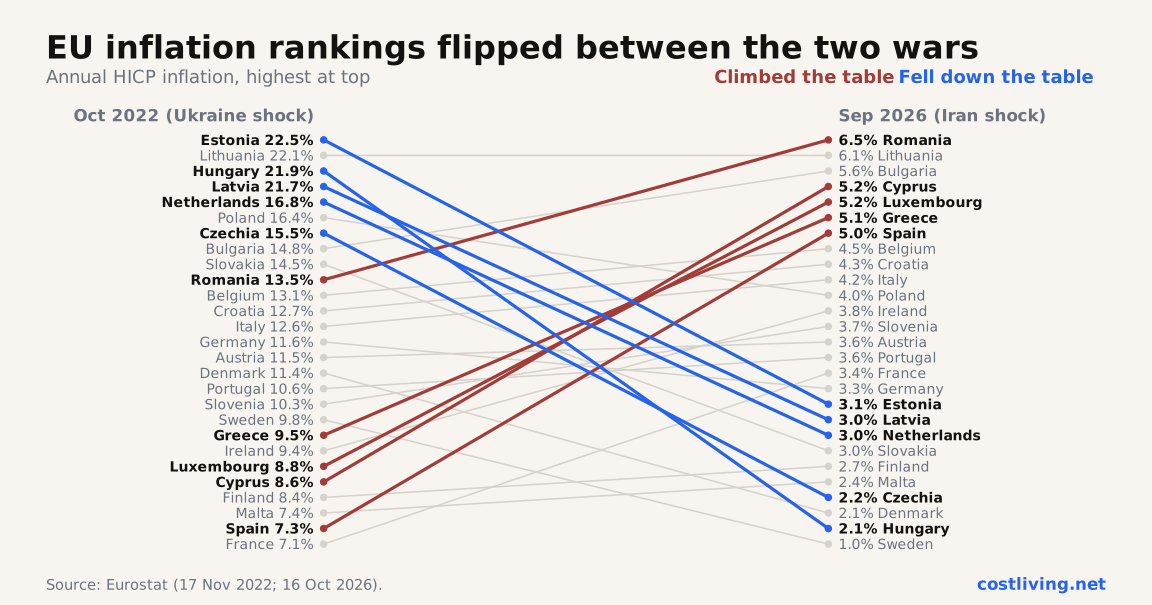
Romania (6.5%), Lithuania (6.1%) and Bulgaria (5.6%) had the highest annual inflation in the EU in September 2026, with Spain seventh at 5.0%, according to Eurostat. In October 2022, Spain had the second-lowest rate in the EU.
| Rank, Sep 2026 | Country | Sep 2026 | Oct 2022 | Rank, Oct 2022 |
|---|---|---|---|---|
| 1 | Romania | 6.5% | 13.5% | 10 |
| 2 | Lithuania | 6.1% | 22.1% | 2 |
| 3 | Bulgaria | 5.6% | 14.8% | 8 |
| 4= | Cyprus | 5.2% | 8.6% | 23 |
| 4= | Luxembourg | 5.2% | 8.8% | 22 |
| 6 | Greece | 5.1% | 9.5% | 20 |
| 7 | Spain | 5.0% | 7.3% | 26 |
| 8 | Belgium | 4.5% | 13.1% | 11 |
| 9 | Croatia | 4.3% | 12.7% | 12 |
| 10 | Italy | 4.2% | 12.6% | 13 |
| 11 | Poland | 4.0% | 16.4% | 6 |
| 12 | Ireland | 3.8% | 9.4% | 21 |
| 13 | Slovenia | 3.7% | 10.3% | 18 |
| 14= | Austria | 3.6% | 11.5% | 15 |
| 14= | Portugal | 3.6% | 10.6% | 17 |
| 16 | France | 3.4% | 7.1% | 27 |
| 17 | Germany | 3.3% | 11.6% | 14 |
| 18 | Estonia | 3.1% | 22.5% | 1 |
| 19= | Latvia | 3.0% | 21.7% | 4 |
| 19= | Netherlands | 3.0% | 16.8% | 5 |
| 19= | Slovakia | 3.0% | 14.5% | 9 |
| 22 | Finland | 2.7% | 8.4% | 24 |
| 23 | Malta | 2.4% | 7.4% | 25 |
| 24 | Czechia | 2.2% | 15.5% | 7 |
| 25= | Denmark | 2.1% | 11.4% | 16 |
| 25= | Hungary | 2.1% | 21.9% | 3 |
| 27 | Sweden | 1.0% | 9.8% | 19 |
| Euro area | 3.8% | 10.6% | ||
| EU | 3.8% | 11.5% |
Source: Eurostat euro indicators, HICP annual rates (16 Oct 2026 and 17 Nov 2022). Ranks are our calculation; = marks a tie.
The table has turned over. In 2022 Estonia, Lithuania, Hungary and Latvia, exposed to Russian gas, topped the table while France and Spain sat at the bottom. In 2026 the oil and fuel shock lifts southern Europe and the Mediterranean, where transport fuel takes a bigger share of household spending, while Hungary is now joint 25th. Spain’s statistics office puts its September rise down to fuel: fuels up 27.7%, food and non-alcoholic drinks up just 2.7%.
Which Countries Are Most Exposed to the Strait of Hormuz?
About 80% of the oil and 90% of the LNG that passes through Hormuz goes to Asia, according to the IEA. Gulf crude made up 77% of Japan’s crude supply and 62% of South Korea’s crude imports in 2025.
| Country or region | Exposure | Source (date) |
|---|---|---|
| Japan | Gulf crude = 77% of crude supply | IEA Oil Market Report (12 Mar 2026) |
| South Korea | Gulf crude = 62% of crude imports | IEA (12 Mar 2026) |
| China | Just over 50% of seaborne crude from the Gulf; China and India take 44% of Hormuz crude | IEA (12 Mar 2026); IEA Hormuz factsheet (2026) |
| India | Gulf = 40% of 4.9 million b/d of crude imports | IEA (12 Mar 2026) |
| Bangladesh, India, Pakistan | Almost two-thirds of their LNG arrives via Hormuz | IEA Hormuz factsheet (2026) |
| Europe | About 7% of Europe’s LNG imports and 4% of Hormuz crude | IEA |
| Bypass pipelines | 3.5 to 5.5 million b/d of spare capacity around the strait | IEA |
| EU energy import dependency, 2024 | 57%; Malta 98%, Luxembourg 91%, Cyprus 88%; Estonia 5% | Eurostat (18 Mar 2026) |
The inflation ranking broadly follows this map: the Philippines, Pakistan, Sri Lanka and Bangladesh, which import most of their fuel and much of it via Hormuz, saw the sharpest jumps. Japan is even more dependent but has held energy inflation negative through subsidies, so dependence alone does not predict the inflation outcome.
How Much Did the Ukraine War Raise Prices in 2022?
Brent crude peaked at $133.18 a barrel on 8 March 2022, twelve days after Russia’s invasion, according to EIA data, and the FAO Food Price Index hit its all-time high that month, up 12.6% in a single month. The biggest shock was gas: the Dutch TTF spot price hit a record €320 per megawatt-hour on 26 August 2022.
| Commodity | 2021 average | 2022 peak | Rise | Source |
|---|---|---|---|---|
| Brent crude | $70.86/bbl | $133.18 (8 Mar 2022) | +88% | EIA daily spot prices |
| European gas (TTF spot) | n/a | €320/MWh (26 Aug 2022) | European Commission, Quarterly Report on European Gas Markets Q3 2022 | |
| European gas (World Bank series) | $16.12/mmbtu | $70.04 (Aug 2022) | +334% | World Bank Pink Sheet |
| FAO Food Price Index | n/a | 159.3 at first release, about 160.2 in the current series (Mar 2022) | +33.6% y/y | FAO (8 Apr 2022) |
| Wheat (US HRW) | $315/tonne | $522 (May 2022) | +66% | World Bank Pink Sheet |
| Sunflower oil | $1,404/tonne | $2,361 (Mar 2022) | +68% | World Bank Pink Sheet |
| Urea | $483/tonne | $925 (Apr 2022) | +91% | World Bank Pink Sheet |
| Potash | $543/tonne | $1,202 (Apr 2022) | +121% | World Bank Pink Sheet |
Russia and Ukraine supplied about 30% of world wheat exports in 2021 and 78% of sunflower oil exports, according to the FAO. Russia alone supplied 16% of global urea exports, and Russia and Belarus together about 40% of potash, according to the US Department of Agriculture. The Black Sea Grain Initiative moved 32.8 million tonnes of food out of Ukraine between August 2022 and July 2023, according to the UN.
Where did inflation peak after Russia invaded Ukraine?
Euro area inflation peaked at 10.6% in October 2022, the highest since the euro was created, with energy up 41.5%, according to Eurostat. UK inflation peaked at 11.1% the same month and US inflation at 9.1% in June 2022, the highest since 1981.
| Economy | Peak rate | Month | Source |
|---|---|---|---|
| Euro area (HICP) | 10.6%; energy 41.5% | Oct 2022 | Eurostat |
| European Union (HICP) | 11.5% | Oct 2022 | Eurostat |
| OECD | 10.7%; food 16.1%, highest since 1974; energy 28.1% | Oct 2022 | OECD |
| United Kingdom (CPI) | 11.1%, highest since the series began in 1997; food 16.2% | Oct 2022 | ONS |
| United States (CPI) | 9.1%, highest since Nov 1981; energy 41.6% | Jun 2022 | BLS |
| Hungary (HICP) | 26.2% | Jan 2023 | Eurostat |
| Estonia (HICP) | 25.2% | Aug 2022 | Eurostat |
| Lithuania (HICP) | 22.5% | Sep 2022 | Eurostat |
| Netherlands (HICP) | 17.1% | Sep 2022 | Eurostat |
| Germany (HICP) | 11.6% | Oct 2022 | Eurostat |
| Ukraine | 26.6% | Oct 2022 | National Bank of Ukraine |
| Russia | 17.83% | Apr 2022 | Bank of Russia |
Sri Lanka’s inflation peaked at 69.8% in September 2022 and Pakistan’s at 38.0% in May 2023. Both were domestic crises made worse by the commodity shock rather than caused by it.
How much of the 2022 inflation was caused by the war?
Energy and food accounted for more than two-thirds of euro area inflation in 2022, according to the ECB, and the Federal Reserve estimated that the war added about 1.3 percentage points to global inflation by the second half of 2022.
| Estimate | Figure | Source (date) |
|---|---|---|
| Federal Reserve Board | War raised global inflation by about 1.3 points and cut global output by about 1.5% by H2 2022 | FEDS Note (27 May 2022) |
| ECB | Energy and food made up more than two-thirds of the 8.4% euro area inflation in 2022 | ECB Blog (24 Feb 2023) |
| Eurostat | Energy contributed 4.44 points and food 2.74 points of the 10.6% October 2022 peak, about 68% | Eurostat (17 Nov 2022) |
| ECB staff, March 2022 | Raised the 2022 inflation forecast from 3.2% to 5.1%; outturn 8.4% | ECB (Mar 2022) |
| IMF | Global inflation 8.8% in 2022, up from 4.7% in 2021 | IMF WEO (Oct 2022) |
No official body has published a single “X% of inflation was the war” figure for 2022, because pandemic supply problems and stimulus were already pushing prices up before the invasion.
What Did the Ukraine Shock Cost Households?
Real wages across the OECD fell 3.8% in the year to the first quarter of 2023, in 30 of 34 countries with data, according to the OECD. In Britain, Ofgem’s cap for a typical household rose from £1,277 in October 2021 to an announced £3,549 in October 2022, though the government held bills at about £2,500.
| Measure | Figure | Source (date) |
|---|---|---|
| OECD real wages | Down 3.8% y/y in Q1 2023; falling in 30 of 34 countries | OECD Employment Outlook (11 Jul 2023) |
| UK Ofgem cap, Oct 2021 | £1,277 | Ofgem (6 Aug 2021) |
| UK Ofgem cap, Oct 2022 (announced) | £3,549, up 80% on April | Ofgem (26 Aug 2022) |
| UK Energy Price Guarantee | Typical bill held at about £2,500 from 1 Oct 2022 | UK Government (8 Sep 2022) |
| EU population unable to keep home adequately warm | 6.9% (2021), 9.3% (2022), 10.6% (2023), 9.2% (2024) | Eurostat EU-SILC |
| Worst in 2024 | Bulgaria 19.0%, Greece 19.0%, Lithuania 18.0%, Spain 17.5% | Eurostat (2 Feb 2026) |
| European energy-crisis support, Sep 2021 to Jan 2023 | €540 billion by EU governments; €651 billion including UK and Norway | Bruegel (Jun 2023) |
| People facing hunger worldwide | 735 million in 2022, 122 million more than in 2019 | FAO SOFI 2023 |
Nearly one in five people in Spain and Greece could not keep their home adequately warm in 2024, two years after the gas shock and before the oil shock began. Figures for 2025 and 2026 are due in 2027.
Is the 2026 Shock Bigger Than the 2022 One?
Not yet, on most measures. OECD energy inflation peaked at 15.7% in May 2026 against 28.1% in October 2022, and OECD headline inflation at 4.6% against 10.7%. Oil is the exception: Brent at $130 in October 2026 is within 3% of its 2022 peak.
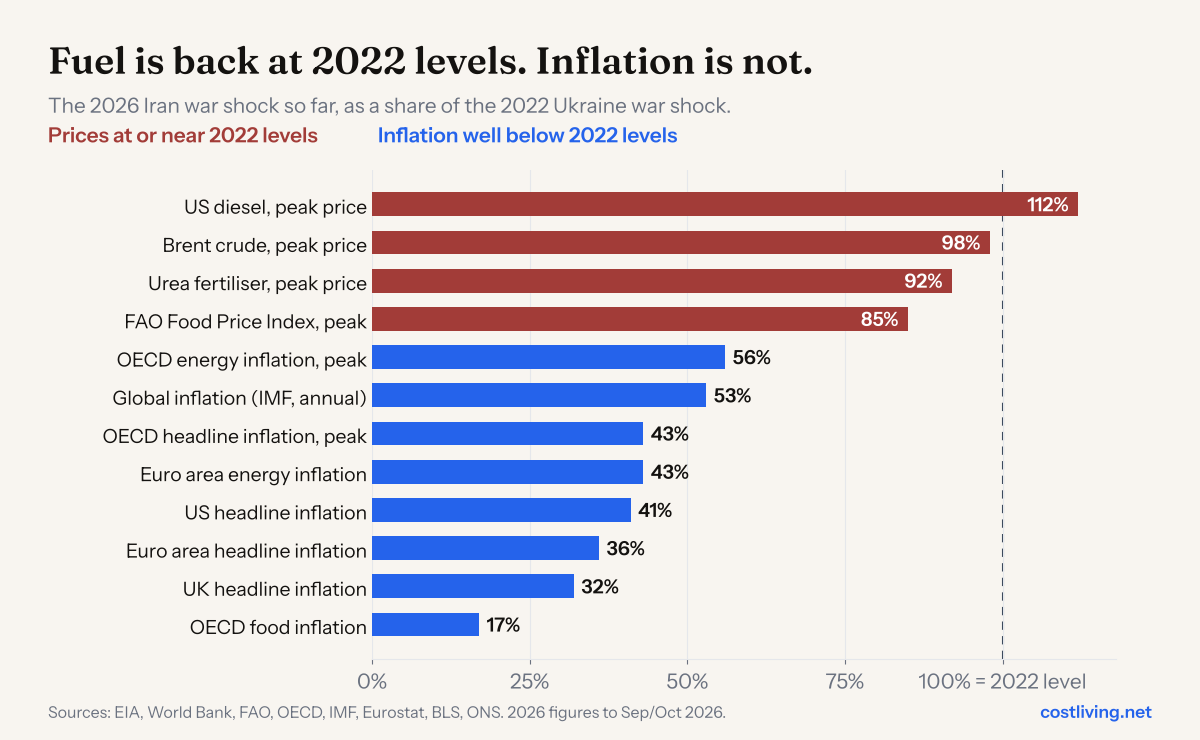
| Measure | Ukraine shock (2022) | Iran shock (2026 so far) | 2026 as % of 2022 | Source |
|---|---|---|---|---|
| Brent spot peak | $133.18 (Mar 2022) | $130.18 (Oct 2026) | 98% | EIA |
| US diesel peak | $5.810 (Jun 2022) | $6.529 (Sep 2026) | 112% | EIA |
| Urea peak | $925/tonne (Apr 2022) | Above $850 (Apr 2026) | About 92% | World Bank |
| FAO Food Price Index peak | About 160 (Mar 2022) | 136.0 (Sep 2026) | 85% | FAO |
| OECD energy inflation peak | 28.1% (Oct 2022) | 15.7% (May 2026) | 56% | OECD |
| Global inflation (IMF, annual) | 8.8% (2022) | 4.7% (2026) | 53% | IMF |
| OECD headline inflation peak | 10.7% (Oct 2022) | 4.6% (May 2026) | 43% | OECD |
| Euro area energy inflation peak | 44.3% (Mar 2022) | 18.9% (Sep 2026) | 43% | Eurostat |
| US headline inflation | 9.1% (Jun 2022) | 3.7% (Sep 2026) | 41% | BLS |
| Euro area headline inflation | 10.6% (Oct 2022) | 3.8% (Sep 2026) | 36% | Eurostat |
| UK headline inflation | 11.1% (Oct 2022) | 3.5% (Sep 2026) | 32% | ONS |
| OECD food inflation | 16.1% (Oct 2022) | 2.8% (Aug 2026) | 17% | OECD |
| European gas | €320/MWh spot (Aug 2022) | About 150% above pre-conflict (Sep 2026), well below 2022 | n/a | European Commission; IMF |
Our working: the last column divides the 2026 figure by the 2022 figure. 2026 figures are the latest or peak so far, and several are still rising.
Three things have kept the 2026 shock smaller for consumers, even with oil at 2022 levels. Gas: Europe’s 2022 crisis was a gas crisis, and Hormuz carries only about 7% of Europe’s LNG. Food: Russia and Ukraine were grain and oilseed exporters, while the Gulf’s role in food runs through fertiliser, and the urea spike reversed within months. Starting point: inflation was 1.9% in the euro area and 2.4% in the US in February 2026, whereas the 2022 shock landed on post-pandemic inflation that was already rising.
The comparison is not settled. The ECB expects euro area inflation to peak only in the fourth quarter of 2026, the Bank of England expects UK inflation above 4% in early 2027, and US diesel is already above its 2022 record.
How Much More Does Life Cost Now Than Before the Wars?
Consumer prices rose 28.3% in the UK between December 2020 and December 2025, 24.4% in the US and 23.2% in the euro area, according to the ONS, BLS and Eurostat. Across the OECD, prices in August 2026 were 39.9% higher than in December 2019.
| Economy | Dec 2020 to Dec 2025 | Dec 2019 to Aug 2026 | Source |
|---|---|---|---|
| OECD | 39.9% | OECD (Oct 2026) | |
| Hungary | 58.5% | OECD | |
| United Kingdom | 28.3% | 32.2% | ONS; OECD |
| United States | 24.4% | 30.4% | BLS; OECD |
| EU | 26.3% | 30.3% | Eurostat; OECD |
| Euro area | 23.2% | 26.7% | Eurostat; OECD |
| Spain | 26.3% | OECD | |
| Germany | 25.3% | OECD | |
| France | 19.1% | OECD | |
| Japan | 13.9% | OECD | |
| Switzerland | 7.7% | OECD |
Our working: €100 of shopping in the euro area at the end of 2020 cost about €123 at the end of 2025, before the 2026 shock. Annual euro area inflation ran 2.6% (2021), 8.4% (2022), 5.4% (2023), 2.4% (2024) and 2.1% (2025).
The EU cut Russia’s share of its gas imports from 45% in 2021 to about 13% in 2025, which is why the 2026 gas shock arrived through prices rather than missing supply. The World Bank puts Ukraine’s reconstruction needs at almost $588 billion over the next decade.
For current monthly living costs by destination, see CostLiving’s pages for Spain, Portugal, Greece, the UK and the United States, or compare the UK and Spain side by side.
How to Read These Numbers
- Spot or futures. EIA’s $130 (October) is the physical Brent spot price; $118 (31 March) is the front-month futures contract. The IEA’s Dated Brent is a third series. The IMF’s “about 50% above pre-war” for September refers to Brent “above $100” during that month, not the October spot high.
- Pre-war or early-war forecasts. IMF forecasts from April 2026 were made six weeks into the war. This page uses the January 2026 update or the October 2025 tables as the pre-war baseline.
- HICP or national CPI. Eurostat’s harmonised index differs from national measures (Spain, September 2026: CPI 4.9%, HICP 5.0%; Greece CPI 5.0%, HICP 5.1%). The EU ranking uses HICP; other figures are labelled.
- Annual average or end of year. IMF projections are annual averages unless stated.
- Point-to-point or 12-month average. Iran’s 89.8% is year on year for one month; the 73.6% also reported is a 12-month average.
- Fertiliser shares. Estimates range from a quarter to a third of traded fertiliser depending on whether they count origin or transit, and urea alone or all fertiliser.
- Scenarios are not outcomes. The WFP’s 45 million and the Dallas Fed’s 0.6 to 1.1 points are model scenarios with stated conditions.
- Ofgem caps. Ofgem changed its typical-consumption assumption in July 2026, so caps before and after are not directly comparable.
- † Secondary sources. These figures were read on a reputable outlet quoting the official body because the official site could not be reached: Statistical Centre of Iran (via IranWire), Bangladesh Bureau of Statistics monthly figures before August (via The Business Standard), Bangladesh fuel rationing (via Prothom Alo and BSS), Qatar National Planning Council (via Qatar News Agency), S&P Global shipping data (via Al Jazeera) and the 26 March Drewry reading (via Daily Cargo News).
Conclusion
The two wars raised the cost of living through different channels. The Ukraine invasion was a gas and grain shock that gave Europe its worst inflation since the euro began and pushed the Baltics and Hungary above 20%. The Iran war is an oil and fuel shock: it has lifted the IMF’s 2026 global inflation forecast from 3.8% to 4.7%, pushed US diesel past its 2022 record, and fallen hardest on Iran, the Gulf economies that cannot ship their oil, and fuel importers from Pakistan and the Philippines to Spain and Greece. Oil is back at 2022 levels; how much of the rest follows depends on how long the strait stays contested.
Sources
IEA, Oil Market Report (12 Mar 2026; 14 Oct 2026) · IEA, commentaries (11 Mar, 22 Jun, 18 Sep 2026) · IEA, Strait of Hormuz factsheet (2026) · IEA, Gas Market Report Q3 2026 · EIA, World Oil Transit Chokepoints (3 Mar 2026) · EIA, Today in Energy (Apr 2026) · EIA, daily spot prices (Oct 2026) · EIA, weekly retail gasoline and diesel prices by region and state (20 Oct 2026) · EIA, Short-Term Energy Outlook (6 Oct 2026) · European Commission, Weekly Oil Bulletin (Oct 2026) · European Commission, Quarterly Report on European Gas Markets Q3 2022 · ACER, Key developments in European gas wholesale markets (23 Apr 2026) · Bank of England, MPC minutes and Governor’s letter (17 Sep 2026) · Ofgem, press releases (6 Aug 2021, 26 Aug 2022, 27 May 2026, 26 Aug 2026) · UK Government, Energy Price Guarantee (8 Sep 2022) · House of Commons Library, Petrol and diesel prices (6 Oct 2026) · ONS, Consumer price inflation (Oct 2022; 21 Oct 2026) · BLS, CPI news releases (13 Jul 2022; 14 Oct 2026) · Federal Reserve Bank of Dallas (17 Apr 2026) · Federal Reserve Board, FEDS Note (27 May 2022) · Eurostat, euro indicators (17 Nov 2022; 16 Oct 2026); HICP database; EU-SILC (2 Feb 2026); energy import dependency (18 Mar 2026) · ECB, staff projections (Mar 2022; 10 Sep 2026); ECB Blog (24 Feb 2023) · IMF, World Economic Outlook (Oct 2022; Oct 2025 Statistical Appendix; 13 Oct 2026 and Statistical Appendix); WEO Update (19 Jan 2026); Regional Economic Outlook: Middle East and Central Asia (22 Oct 2026); MCD press briefing (20 Oct 2025; 16 Apr 2026) · OECD, Consumer Prices (6 Oct 2026); Economic Outlook (3 Jun 2026); Employment Outlook (11 Jul 2023; 7 Jul 2026) · World Bank, Commodity Markets Outlook (Apr 2026); Pink Sheet; Data Blog (14 May 2026); Food Security Update (27 Mar 2026); Global Economic Prospects (Jun 2026); Ukraine RDNA5 (23 Feb 2026) · FAO, Food Price Index releases (8 Apr 2022; 6 Mar, 3 Apr, 2 Oct 2026); Chief Economist statement (26 Mar 2026); SOFI 2023 · FAO-WFP, Hunger Hotspots (17 Jun 2026) · WFP (17 Mar 2026) · UNCTAD (10 Mar and 28 Apr 2026) · UN, Black Sea Grain Initiative (15 Jul 2023) · USDA ERS, Amber Waves (18 Sep 2023) · Bruegel (Jun 2023) · Lloyd’s Market Association, JWLA-033 (3 Mar 2026) · Drewry, World Container Index (15 Oct 2026) · Freightos (31 Mar and 14 Apr 2026) · National Bank of Ukraine (Nov 2022) · Bank of Russia (14 Jun 2022) · Pakistan Bureau of Statistics (May 2026) · Philippine Statistics Authority (5 May 2026) · Central Bank of Sri Lanka (30 Apr 2026) · Central Bank of the Republic of Türkiye (5 May 2026) · Kenya National Bureau of Statistics (29 May 2026) · Bangladesh Bank (Sep 2026) · MoSPI India (13 Jul 2026) · Statistics Bureau of Japan (Sep 2026) · INE Spain (14 Oct 2026) · INE Portugal (13 Oct 2026) · ELSTAT (9 Oct 2026) · IranWire (1 Oct 2026) † · Qatar News Agency (18 May 2026) † · Prothom Alo and BSS (Mar 2026) † · The Business Standard † · Al Jazeera (23 Jul 2026) † · Daily Cargo News (26 Mar 2026) †
Full source list: every figure with its publisher, release date and link (143 entries)
| ID | Figure | Publisher | Release | Link |
|---|---|---|---|---|
| E1 | 20.9 million b/d of oil through Hormuz, ~20% of global petroleum liquids consumption; LNG 11.4 Bcf/d, >20% of global LNG trade | EIA, World Oil Transit Chokepoints | 1H2025, page updated 3 Mar 2026 | Source |
| E2 | ~20 mb/d of crude and product exports disrupted; Hormuz flows “from around 20 mb/d to a trickle”; “largest supply disruption in the history | IEA Oil Market Report March 2026 | 12 Mar 2026 | Source |
| E3 | 400 million barrels emergency stock release, largest IEA collective action ever | IEA | 11 Mar 2026 | Source |
| E4 | Hormuz flows averaged 2.7 mb/d Mar-May 2026 vs ~20 mb/d pre-war; cumulative Middle East supply losses >1.3 billion barrels | IEA commentary | 22 Jun 2026 | Source |
| E5 | Hormuz flows 7.6 mb/d in Aug 2026; cumulative export losses approaching 2.8 billion barrels; stocks 507 mb below war onset | IEA commentary | 18 Sep 2026 | Source |
| E6 | Hormuz flows 10.9 mb/d Sept 2026; 2026 world supply 100.7 mb/d (-5.8 mb/d); demand 102.4 mb/d (-2.6 mb/d); North Sea Dated Sept avg $116.89; | IEA Oil Market Report October 2026 | 14 Oct 2026 | Source |
| E7 | Brent futures ~$72/b end-Feb 2026, >$100 on 12 Mar, $118/b on 31 Mar; Q1 real-terms rise largest since 1988 | EIA Today in Energy | Apr 2026 | Source |
| E8 | Brent spot $130.18/bbl on 8 Oct 2026; $126.55 on 14 Oct; WTI $101.91 on 14 Oct | EIA spot prices | 8-14 Oct 2026 | Source |
| E9 | Brent spot $71.32 on 27 Feb 2026 (pre-war baseline) | EIA | 27 Feb 2026 | Source |
| E10 | EIA forecasts Brent $96/b avg 2026, $105 in 4Q26, $84 in 2027 | EIA | 6 Oct 2026 | Source |
| E11 | US regular gasoline $2.937/gal (wk 23 Feb 2026), peak $4.500 (11 May 2026), $4.284 (19 Oct 2026) | EIA weekly retail | 2026 | Source |
| E12 | US on-highway diesel $6.276/gal on 19 Oct 2026, +$2.656 vs year earlier | EIA Gasoline and Diesel Fuel Update | 19 Oct 2026 | Source |
| E13 | UK petrol ~130p/l and diesel ~140p/l in Feb 2026, ~170p and ~190p by mid-Sept | Bank of England Governor letter | 17 Sep 2026 | Source |
| E14 | UK diesel record 199.5p/l on 5 Oct 2026, above July 2022 high; petrol 174.9p | House of Commons Library SN04712 | 6 Oct 2026 | Source |
| E15 | UK Sept 2026 average petrol 169.5p/l, diesel 192.5p/l; motor fuels +29.8% y/y | ONS | Sept 2026, pub 21 Oct 2026 | Source |
| E16 | EU average diesel €1.59/l and petrol €1.64/l (23 Feb 2026), record diesel €2.24 and petrol €2.10 (28 Sep 2026) | European Commission, Weekly Oil Bulletin price history (XLSX) | 2026 | Source · Link 2 |
| G1 | TTF about +70% week-on-week after the first strikes (p.3). Qatar Ras Laffan attacks curtail 17% of its LNG export capacity; EU storage | ACER | 23 Apr 2026 | Source |
| G2 | TTF Q2 2026 avg ~$16/MBtu (+32% y/y); JKM Q2 avg $17.5/MBtu (+45% y/y); Hormuz almost 20% of global LNG; Qatar+UAE 2026 LNG supply down ~54- | IEA | Jul 2026 | Source |
| G3 | UK wholesale gas 207p/therm on 14 Sep 2026, +78% since before July MPR; Brent $106 | Bank of England | 17 Sep 2026 | Source |
| G4 | Ofgem cap: £1,641 to £1,663 from 1 Jul 2026 on new consumption values (13% rise like-for-like, +£18/month); Ofgem cites Middle East conflict | Ofgem | 27 May 2026 | Source |
| G5 | Ofgem cap £1,663 to £1,723 from 1 Oct 2026 (+4%, +£60/yr); gas element +8% | Ofgem | 26 Aug 2026 | Source |
| F1 | FAO Food Price Index 125.3 (Feb 2026) | FAO | Feb 2026 | Source |
| F2 | FAO FFPI 128.5 in March 2026, +2.4% m/m; FAO attributes rise to Near East conflict and Hormuz closure | FAO | 3 Apr 2026 | Source |
| F3 | FAO FFPI 136.0 in Sept 2026, +1.5% m/m, +5.8% y/y; cereals 122.8 (+17.2% y/y); 15.1% below March 2022 peak | FAO | 2 Oct 2026 | Source |
| F4 | Tanker traffic through Hormuz fell >90% within days; war-risk insurance premiums from 0.25% to as high as 10% of vessel value; Hormuz carrie | FAO | 26 Mar 2026 | Source |
| F5 | Urea up nearly 46% m/m Feb-Mar 2026; ~one-third of global fertiliser trade transits Hormuz; food inflation >5% in ~50 of 149 countries Q1 20 | World Bank | 27 Mar 2026 | Source |
| F6 | World Bank fertiliser index forecast +30.7% in 2026; urea $675/mt avg 2026 (+59.7%); energy index +24%; food index +2.4% | World Bank | 28 Apr 2026 | Source |
| F7 | Urea above $850/mt in April 2026, +80% since Feb, highest since Apr 2022; sulphur doubled since Jan; Middle East ~one-quarter of global urea | World Bank | 14 May 2026 | Source |
| F8 | WFP: up to 45 million more people into acute hunger if conflict persists to mid-2026 and oil >$100; baseline 318 million | WFP | 17 Mar 2026 | Source |
| F9 | 13 hunger hotspots Jun-Nov 2026; ~266 million in high acute food insecurity; Somalia deterioration partly from Middle East conflict ripple e | FAO-WFP | 17 Jun 2026 | Source |
| S1 | Hormuz ship transits fell ~95%; Strait carries ~one quarter of seaborne oil and ~one-third of seaborne fertiliser trade (~16 Mt) | UNCTAD | 10 Mar and 28 Apr 2026 | Source · Link 2 |
| S2 | Drewry World Container Index $4,485/40ft on 15 Oct 2026; Shanghai-LA $7,884; Shanghai-Rotterdam $3,522 | Drewry | 15 Oct 2026 | Source |
| S3 | Drewry WCI $2,279/40ft on 26 Mar 2026 † | Drewry via Daily Cargo News | 26 Mar 2026 | Source |
| S4 | Freightos: Asia-N. Europe $2,900/FEU (+$500 since war began); emergency fuel surcharges $300-500/FEU; South Asia-Europe air cargo +65% vs en | Freightos | 31 Mar 2026 | Source |
| S5 | Jet fuel more than doubled since Hormuz closure; Middle East flights ~60% below pre-war; transatlantic rates +50% in a week to >$2,100/FEU | Freightos | 14 Apr 2026 | Source |
| S6 | War-risk premiums 7.5-10% of hull value in Jul 2026 vs 1-3% previously; Gulf-China VLCC freight $77.96/mt (22 Jul) vs 5-yr avg $18.91 and ~$ † | S&P Global via Al Jazeera | 22 Jul 2026 | Source |
| I1 | IMF: global inflation 4.7% in 2026 (4.1% in 2025), 4.1% in 2027; cumulative +0.7pp revision vs April; “war-induced negative supply shock”; o | IMF | 13 Oct 2026 | Source |
| I2 | IMF April 2026 WEO: global growth 3.1% (pre-conflict 3.4%), inflation 4.4% in 2026; adverse scenario 5.4% | IMF | 14 Apr 2026 | Source |
| I3 | IMF July 2026: energy prices roughly 25% above pre-war; sequential headline inflation jumped almost 4pp between Feb and Apr | IMF | Jul 2026 | Source |
| I4 | OECD: global oil supply fell 12% Feb-Apr 2026; G20 inflation 4.0% in 2026 (3.4% in 2025); prolonged scenario adds +0.4pp (2026) and +1.3pp ( | OECD | 3 Jun 2026 | Source |
| I5 | OECD energy inflation -0.5% (Feb 2026) to 15.7% (May) and 13.6% (Aug 2026); headline 3.4% (Feb) to 4.3% (Aug); food 2.8% Aug, lowest since J | OECD | 6 Oct 2026 | Source |
| I6 | Euro area HICP 1.9% in Feb 2026; energy -3.1% (pre-war baseline); March 2.5%, energy +4.9% | Eurostat | 31 Mar 2026 | Source |
| I7 | Euro area HICP 3.8% Sept 2026 (Aug 3.2%; Sept 2025 2.2%); energy +18.9% y/y, contributing 1.71pp; food/alc/tob 1.3%; EU 3.8% | Eurostat | 16 Oct 2026 | Source |
| I8 | ECB: HICP 3.0% (2026), 2.5% (2027), peak 3.6% Q4 2026; deposit rate raised to 2.50% | ECB | 10 Sep 2026 | Source · Link 2 |
| I9 | US CPI Feb 2026 2.4% y/y (baseline) | BLS flat file | Feb 2026 | Source |
| I10 | US CPI March 2026 +3.3% y/y, +0.9% m/m; energy +10.9% m/m; gasoline +21.2% m/m | BLS TED | Apr 2026 | Source |
| I11 | US CPI Sept 2026 +3.7% y/y; energy +20.4%; gasoline +34.2%; fuel oil +74.2%; core 2.6% | BLS | 14 Oct 2026 | Source · Link 2 |
| I12 | Dallas Fed: one-quarter Hormuz closure adds +0.6pp to headline PCE inflation; three-quarter closure +1.1pp | Dallas Fed | 17 Apr 2026 | Source |
| I13 | UK CPI 3.0% Feb 2026; 3.5% Sept 2026; BoE: ~0.7pp of the 1.1pp overshoot from direct energy effects; CPI expected ~3.75% Q4 2026 | ONS / BoE | Sept 2026 | Source · Link 2 |
| I14 | World Bank GEP: global growth 2.5% in 2026, lowest since pandemic; Brent $94 (+36%); MNA region growth 1.6% (-2.7pp); 1/4 of developing econ | World Bank | 11 Jun 2026 | Source |
| C1 | Iran point-to-point inflation 89.8% Sept 2026 (68.1% Feb 2026); 12-month avg 73.6% † | SCI (secondary) | 1 Oct 2026 | Source |
| C2 | IMF: Iran inflation 78.6% in 2026 (50.6% in 2025), 2nd highest in world after Venezuela 467.9%; Sudan 41.3, Argentina 32.5, Türkiye 31.2 | IMF WEO Oct 2026 | 13 Oct 2026 | Source |
| C3 | IMF 2026 inflation projections: Philippines 5.6 (1.7 in 2025); UAE 4.5 (1.3); Qatar 3.6 (0.6); Spain 3.7; Greece 4.2; US 3.6; euro area 3.1; | IMF WEO Oct 2026 Tables A6/A7 | 13 Oct 2026 | Source |
| C4 | IMF: Bahrain, Iraq, Kuwait, Qatar projected double-digit GDP contractions 2026; Saudi -3.3% | IMF | 13 Oct 2026 | Source |
| C5 | Pakistan CPI 7.0% Feb, 10.89% Apr, 11.7% May 2026; transport +36.78% y/y May; urban motor fuel +51.9% y/y May | Pakistan Bureau of Statistics | May 2026 | Source |
| C6 | Philippines inflation 7.2% Apr 2026 (4.1% Mar; 1.4% Apr 2025), highest since Mar 2023; transport +21.4%; rice +13.7% | Philippine Statistics Authority | 5 May 2026 | Source |
| C7 | Sri Lanka CCPI 5.4% Apr 2026 vs 2.2% Mar; CBSL attributes to Middle East war spillovers | Central Bank of Sri Lanka | 30 Apr 2026 | Source |
| C8 | Türkiye CPI 32.37% Apr 2026; energy +14.40% m/m, +47.22% y/y; CBRT cites Middle East conflict | CBRT / TurkStat | 5 May 2026 | Source |
| C9 | Kenya inflation 6.7% May 2026 (5.6% Apr); transport +16.5%; Nairobi diesel KSh 232.86/l (+41.2% y/y) | Kenya National Bureau of Statistics | 29 May 2026 | Source · Link 2 |
| C10 | Bangladesh point-to-point inflation 8.26% Aug, 8.34% Sept 2026 | Bangladesh Bank | Sept 2026 | Source |
| C11 | Bangladesh fuel rationing from 6 Mar 2026: motorcycles 2 litres/day, cars 10 litres † | Prothom Alo | 7 Mar 2026 | Source |
| C12 | India CPI 3.21% Feb to 4.38% Jun 2026; Aug 4.82% | MoSPI | Jul/Sep 2026 | Source |
| C13 | Japan CPI Aug 2026 +1.9%; energy -0.7% y/y (subsidies) | Statistics Bureau of Japan | 18 Sep 2026 | Source |
| C14 | Egypt headline inflation 13.4% Apr 2026; transport & communications +24.5% y/y † | CAPMAS | 6 May 2026 | Source |
| C15 | Qatar CPI +2.62% Apr 2026; food & beverages +10.41% y/y † | Qatar National Planning Council | 18 May 2026 | Source |
| C16 | UNDP: Arab States GDP loss 3.7-6.0% ($120-194bn) from four-week war; GCC -5.2 to -8.5%; 1.6-3.6m jobs lost; 3.05-3.96m more in poverty | UNDP | 30 Mar 2026 | Source |
| C17 | World Bank: MENAAP output to contract 2.1% in 2026; GCC -4.3% | World Bank | 6 Oct 2026 | Source |
| C18 | Eurostat HICP Sept 2026 by state: Romania 6.5, Lithuania 6.1, Bulgaria 5.6, Cyprus 5.2, Luxembourg 5.2, Greece 5.1, Spain 5.0, Belgium 4.5, | Eurostat | 16 Oct 2026 | Source |
| C19 | OECD Aug 2026: Türkiye 31.5, Colombia 6.2, Lithuania 6.1, Iceland 5.6, Spain 4.3 (national CPI), US 3.4, UK 3.3, Germany 2.9, France 2.4, Ja | OECD | 6 Oct 2026 | Source |
| C20 | OECD: real statutory minimum wages -1.5% on average since start of 2026 on energy surge; 13 of 37 countries real wages still below Q1 2021 | OECD | 7 Jul 2026 | Source |
| X1 | ~80% of Hormuz oil goes to Asia; China+India take 44% of Hormuz crude; Bangladesh, India, Pakistan import almost two-thirds of their LNG via | IEA | 2025/2026 | Source |
| X2 | Gulf arrivals = 77% of Japan’s crude supply, 62% of South Korea’s; 40% of India’s crude imports; just over 50% of China’s seaborne crude | IEA | 12 Mar 2026 | Source |
| X3 | EU energy import dependency 57% (2024); Malta 98%, Luxembourg 91%, Cyprus 88%; Estonia 5%, Sweden 27% | Eurostat | 18 Mar 2026 | Source |
| X4 | IMF: GCC >40% of global sulphur exports, ~20% of ammonia and nitrogen fertiliser exports; Ras Laffan ~17% of global LNG capacity | IMF (Azour) | 16 Apr 2026 | Source |
| U1 | Brent spot peak $133.18/bbl on 8 Mar 2022; 2022 avg $100.93 vs $70.86 in 2021; 23 Feb 2022 $99.29 | EIA | 2022 | Source |
| U2 | TTF spot record 320 EUR/MWh on 26 Aug 2022; Q3 2022 avg 198 EUR/MWh; Russia 16% of extra-EU gas imports in Q3 2022, down 27pp y/y | European Commission | Jan 2023 | Source |
| U3 | FAO FFPI 159.3 in March 2022, all-time high, +12.6% m/m, +33.6% y/y | FAO | 8 Apr 2022 | Source |
| U4 | Wheat (US HRW) $522.29/mt May 2022 vs 2021 avg $315.2; sunflower oil $2,361/mt Mar 2022 vs $1,404; urea $925/mt, DAP $954, potash $1,202 in | World Bank | 2022 | Source |
| U5 | Russia + Ukraine ~30% of world wheat exports, ~78% of sunflower oil exports (3-yr avg); nearly 50 countries rely on them for >=30% of wheat | FAO | 11 Mar 2022 | Source |
| U6 | Russia ~16% of global urea exports, 12% phosphate; Russia+Belarus ~40% of potash exports; fertiliser prices +50% Feb-Apr 2022 | USDA | 18 Sep 2023 | Source |
| U7 | Black Sea Grain Initiative: 32.8 million tonnes exported in 1,003 voyages (Aug 2022-Jul 2023) | UN | 15 Jul 2023 | Source |
| P1 | Euro area HICP 10.6% Oct 2022; EU 11.5%; energy +41.5% (4.44pp); food/alc/tob +13.1% (2.74pp); Estonia 22.5, Lithuania 22.1, Hungary 21.9, L | Eurostat | 17 Nov 2022 | Source |
| P2 | Hungary HICP 26.2% Jan 2023; Estonia 25.2% Aug 2022; Czechia 19.1% Jan 2023; Poland 17.2% Feb 2023; Netherlands 17.1% Sep 2022; Germany 11.6 | Eurostat | 2022-23 | Source |
| P3 | UK CPI 11.1% Oct 2022, highest since 1997 series; food 16.4%; electricity/gas/other fuels contributed 2.59pp | ONS | Oct 2022 | Source |
| P4 | US CPI 9.1% June 2022, largest since Nov 1981; energy +41.6%; food +10.4% | BLS | 13 Jul 2022 | Source |
| P5 | OECD headline 10.7% Oct 2022; food 16.1% (highest since May 1974); energy 28.1%; G20 9.5% | OECD | 6 Dec 2022 | Source |
| P6 | Ukraine inflation 26.6% y/y Oct 2022 (peak) | National Bank of Ukraine | Nov 2022 | Source |
| P7 | Russia inflation 17.83% April 2022 | Bank of Russia | 14 Jun 2022 | Source |
| P8 | IMF annual avg inflation 2022: Zimbabwe 193.4, Venezuela 186.5, Lebanon 171.2, Sudan 138.8, Argentina 72.4, Türkiye 72.3, Sri Lanka 45.2; Ne | IMF WEO Oct 2026 | 13 Oct 2026 | Source |
| A1 | Fed FEDS Note: war raised global inflation ~1.3pp and cut global output ~1.5% by H2 2022 | Federal Reserve Board | 27 May 2022 | Source |
| A2 | ECB: energy and food accounted for more than two-thirds of euro area inflation in 2022 (8.4% vs 2.6% in 2021) | ECB | 24 Feb 2023 | Source |
| A3 | ECB March 2022 staff projections: 2022 inflation baseline 5.1% (from 3.2% in Dec 2021); severe scenario 7.1%; outturn 8.4% | ECB | 2 Mar 2022 | Source |
| A4 | BIS: oil +30% and agricultural commodities +10% historically add ~1pp to inflation the following year; Russia ~12% of global oil, 17% of gas | BIS | 26 Jun 2022 | Source |
| A5 | IMF: global inflation 8.8% in 2022 from 4.7% in 2021 | IMF | 11 Oct 2022 | Source |
| H1 | Ofgem cap £1,138 to £1,277 from 1 Oct 2021 | Ofgem | 6 Aug 2021 | Source |
| H2 | Ofgem cap £1,971 to £3,549 (+80%) from 1 Oct 2022 | Ofgem | 26 Aug 2022 | Source · Link 2 |
| H3 | Energy Price Guarantee held typical bill at ~£2,500 from 1 Oct 2022 | UK Government | 8 Sep 2022 | Source |
| H4 | OECD real wages fell 3.8% y/y in Q1 2023; negative in 30 of 34 countries | OECD | 11 Jul 2023 | Source |
| H5 | EU population unable to keep home adequately warm: 6.9% (2021), 9.3% (2022), 10.6% (2023), 9.2% (2024); 2024: Bulgaria 19.0, Greece 19.0, Li | Eurostat | 2 Feb 2026 | Source · Link 2 |
| H6 | European energy-crisis support: EUR 540bn EU member states; EUR 651bn incl. UK and Norway; Germany EUR 158bn | Bruegel | Jun 2023 | Source |
| H7 | 735 million people faced hunger in 2022, 122 million more than 2019 | FAO et al. | 12 Jul 2023 | Source |
| H8 | 673 million (8.2%) faced hunger in 2024; 2.6 billion could not afford a healthy diet | FAO DG statement | 28 Jul 2025 | Source |
| H9 | Euro area food, alcohol & tobacco HICP peak 15.5% Mar 2023; EU food & non-alc beverages 19.2% Mar 2023 | Eurostat prc_hicp_manr | 8 May 2023 | Source |
| L1 | Cumulative price level Dec 2020 to Dec 2025: euro area +23.2%, EU +26.3%, UK +28.3%, US +24.4% | Eurostat / ONS / BLS | Dec 2025 | Source · Link 2 · Link 3 |
| L2 | Euro area annual HICP: 2.6% (2021), 8.4% (2022), 5.4% (2023), 2.4% (2024), 2.1% (2025) | Eurostat | 2025 | Source |
| L3 | Russian share of EU gas imports 45% (2021), 19% (2024), ~13% (2025 proj.) | European Commission COM(2025) 440 | 6 May 2025 | Source |
| L4 | Ukraine reconstruction needs ~$588bn over ten years (RDNA5); direct damage >$195bn | World Bank et al. | 23 Feb 2026 | Source |
| L5 | Ukraine inflation peaked 15.9% May 2025, 8.0% Dec 2025 | National Bank of Ukraine | Dec 2025 | Source · Link 2 |
| L6 | Cumulative OECD consumer prices +39.9% Dec 2019 to Aug 2026; G7 +26.9%; euro area +26.7%; UK 32.2; US 30.4; Spain 26.3; Japan 13.9 | OECD | 6 Oct 2026 | Source |
| N1 | EU/Spain/Portugal/Ireland pump prices 23 Feb, peak, 19 Oct 2026 | European Commission Weekly Oil Bulletin history XLSX | 2026 | Source |
| N2 | IMF 2026 real GDP: Kuwait -16.7, Iraq -16.0, Qatar -15.6, Bahrain -11.3, Iran -7.6, UAE -3.9, Saudi -3.3 | IMF WEO Oct 2026 Statistical Appendix Table A | 13 Oct 2026 | Source |
| N3 | Philippines Executive Order 110 (24 Mar 2026) and fuel relief amounts | Philippine Information Agency republishing PCO | Mar-Apr 2026 | Source · Link 2 |
| N4 | Lloyd’s JWC listed areas circular JWLA-033 | Lloyd’s Market Association | 3 Mar 2026 | Source |
| N5 | Spain CPI Sep 2026 4.9%; energy +21.7%; fuels +27.7%; food +2.7%; constant-tax fuels +36.4% | INE Spain | 14 Oct 2026 | Source · Link 2 |
| N6 | Banco de Espana HICP projections 3.9% 2026, 3.7% 2027 | Banco de Espana | 9 Oct 2026 | Source |
| N7 | Portugal CPI Sep 2026 3.6%; energy +15.3% | INE Portugal | 13 Oct 2026 | Source |
| N8 | Greece CPI Sep 2026 5.0%; housing/energy +14.7%; transport +11.3% | ELSTAT | 9 Oct 2026 | Source |
| N9 | FAO FFPI data file: Feb 2026 125.5 (revised), Mar 2022 160.2, Sep 2026 136.0 | FAO | Oct 2026 | Source |
| N10 | World Bank Pink Sheet: Brent Sep 2026 avg $116.8; energy index 148.9 | World Bank | 2 Oct 2026 | Source |
| N11 | Bangladesh inflation Feb-Jul 2026 (9.13 Feb, 9.42 May) † | BBS via The Business Standard | 2026 | Source · Link 2 |
| N12 | BoE Dec 2022 letter: food ~1.8pp of overshoot | Bank of England | 15 Dec 2022 | Source |
| N13 | WFP 345 million acutely food insecure in 82 countries, 2022 | WFP | 2022 | Source |
| N14 | Eurostat energy HICP 44.3% Mar 2022 series high | Eurostat prc_hicp_manr | Mar 2022 | Source |
| N15 | Sri Lanka CCPI 69.8% Sep 2022; Pakistan 38.0% May 2023 | CBSL; PBS | 2022-23 | Source · Link 2 |
| R1 | MENAP GDP -1.3% 2026 (Apr: 1.4%), 6.6% 2027; GCC -4.8% (Apr: 2.0%); country GDP Oct vs Apr (Table 1.2) | IMF Regional Economic Outlook, Middle East and Central Asia | 22 Oct 2026 | Source |
| R2 | MENAP inflation 11.7% 2025, 13.8% 2026; non-GCC oil exporters 24.3% to 38.3%; GCC 2.7% 2026 (Table 1.1, p.24; text p.10) | IMF REO MECA | 22 Oct 2026 | As above |
| R3 | Egypt 14.5% and Pakistan 11.1% y/y Aug 2026; Lebanon ~17%; Bahrain 3.0% (Jul), Oman 3.4% (Aug) | IMF REO MECA p.5 | 22 Oct 2026 | As above |
| R4 | Since 27 Feb to mid-Sep 2026: jet fuel +85%, US diesel +68%, US gasoline +45%, TTF ~+150%, wheat and DAP ~+25%, urea ~-12%; Brent >$100 in Sep, ~50% above pre-war | IMF REO MECA p.2, Figure 1.1 (data to 14-16 Sep 2026) | 22 Oct 2026 | As above |
| R5 | Gulf directly affected exporters’ oil and gas output 33 mb/d (Feb) to ~19 mb/d (May); Qatar down up to 86% | IMF REO MECA p.2 | 22 Oct 2026 | As above |
| R6 | Box 1.1: 1.8bn barrels cumulative supply losses by July; pre-war surplus 2.1 mb/d; non-Gulf supply +280m bbl; demand -750m bbl; inventories -440m bbl | IMF REO MECA Box 1.1, p.19 | 22 Oct 2026 | As above |
| R7 | Oil ~$96 2026, $87 2027, peak ~$110 late 2026; adverse scenario ~$130 in 2027; food prices +5% 2026, +2.4% 2027 | IMF REO MECA p.7 and Box 1.2 | 22 Oct 2026 | As above |
| R8 | Fuel subsidies cut CPI impact by 0.4pp in 2026; fiscal cost 0.5% of GDP | IMF REO MECA Box 1.4, p.23 | 22 Oct 2026 | As above |
| V1 | World CPI inflation 2026 pre-war forecast 3.8% (2025 4.1%, 2027 3.4%); world growth 2026 3.3% | IMF WEO Update | 19 Jan 2026 | Source |
| V2 | World growth 2026 3.1%, 2027 3.4% | IMF WEO | 13 Oct 2026 | Source |
| V3 | Pre-war 2026 GDP: Bahrain 3.3, Egypt 4.5 (FY), Iran 1.1, Iraq 3.6, Kuwait 3.9, Oman 4.0, Pakistan 3.6 (FY), Qatar 6.1, Saudi 4.0, UAE 5.0 | IMF WEO Statistical Appendix Table A4 | Oct 2025 | Source |
| V4 | MENAP 2026 pre-war 3.7% | IMF MCD briefing; REO Apr 2026 key messages (“2.3pp downgrade from October 2025”) | 20 Oct 2025; Apr 2026 | Source |
| V5 | UK CPI annual average 2025 3.4, 2026 3.3, 2027 2.8 | IMF WEO Table A6 | 13 Oct 2026 | Source |
| V6 | HICP all 27 member states, Sep 2026 | Eurostat | 16 Oct 2026 | Source |
| V7 | HICP all 27 member states, Oct 2022 | Eurostat | 17 Nov 2022 | Source |
| V8 | US diesel: 3.809 (23 Feb 2026), peak 6.529 (21 Sep 2026), 6.276 (19 Oct 2026) | EIA | 20 Oct 2026 | Source |
| V9 | Regular gasoline by PADD and 9 states, 23 Feb / peak / 19 Oct 2026 | EIA | 20 Oct 2026 | Source |
| V10 | Brent “above $100 per barrel in September, about 50 percent above pre-war levels”; oil “around $90 since” end of March | IMF REO MECA, p.2 | 22 Oct 2026 | PDF on file |
| V11 | Iran 89.8% Sep 2026 † | Statistical Centre of Iran via IranWire | 1 Oct 2026 | Source |