
The ten most expensive US states report less diagnosed depression than the ten cheapest (18.5% against 23.4%), according to the CDC’s 2024 state survey and the Bureau of Economic Analysis (BEA). Adults on low incomes report far more: 37.4% of those in households earning under $24,000 are depressed or treated for depression, against 15.8% at $120,000 and over (Gallup, 2026).
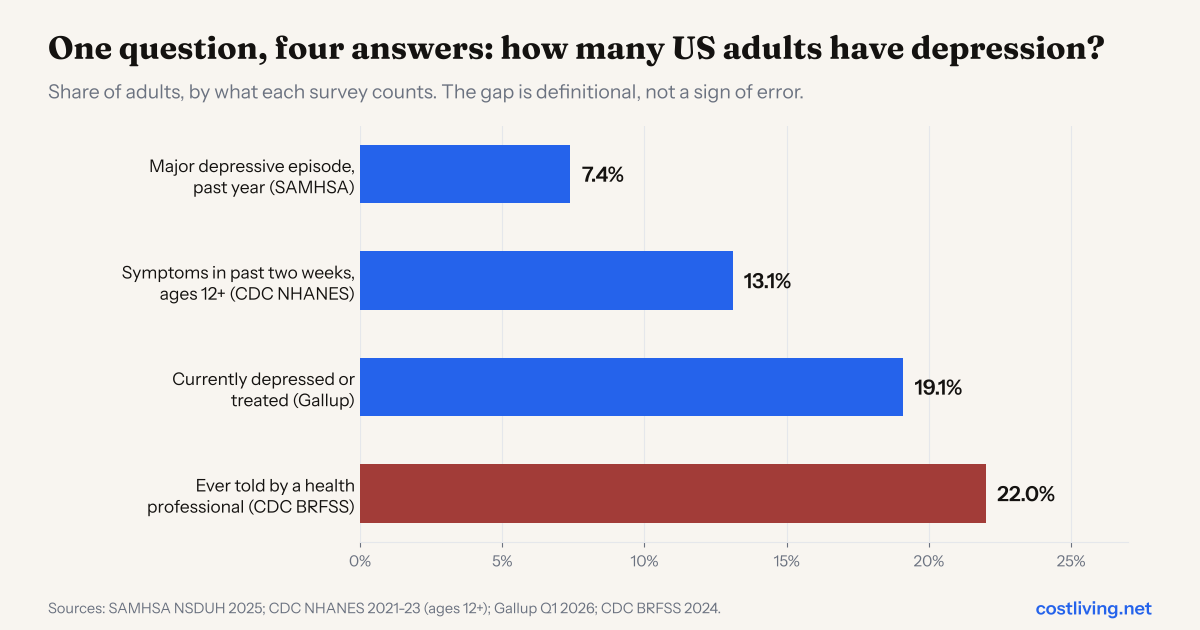
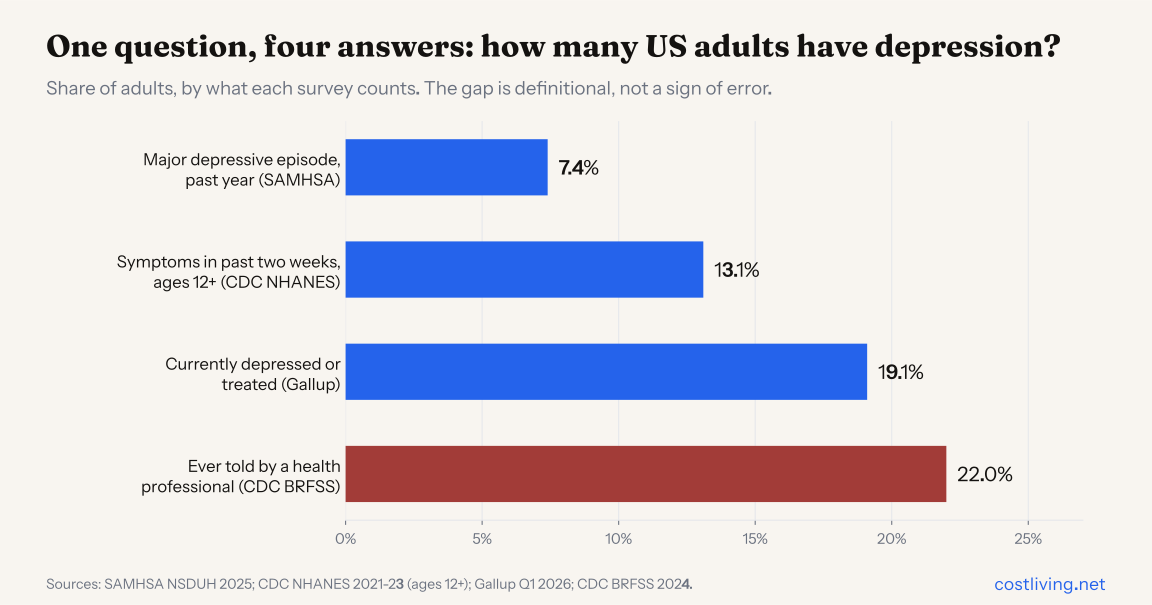
The price link is weaker than it looks. It largely disappears once rural share is taken into account, and a second federal survey finds no link at all. The depression rate itself depends on the survey: the Substance Abuse and Mental Health Services Administration (SAMHSA) counts 7.4% of adults with a major depressive episode in the past year, while the CDC finds 22.0% who have ever been told they have depression.
This page covers how common depression and mental illness are, what the 50 states show when price levels are set against mental health, what money worries and income do to mood, and what mental health care costs and who can reach it. Every figure links to the agency, survey or statistics office that published it. Data updated October 2026.
Top Picks
How common it is
- Adult depression: 7.4% (SAMHSA, past-year episode), 13.1% (CDC, symptom screen, ages 12+), 19.1% (Gallup, current or treated), 22.0% (CDC BRFSS, ever told)
- Any mental illness: 20.6% of adults, 54.6 million, in 2025 (SAMHSA)
- Age gap: 28.6% of adults aged 18 to 25 had any mental illness, against 12.8% of those aged 50 and over (SAMHSA)
- Teenagers: 15.1% of 12 to 17 year olds had a major depressive episode in 2025, down from 20.8% in 2021 (SAMHSA)
Cost of living and mental health by state
- Ten priciest states: 18.5% of adults told they have depression. Ten cheapest: 23.4% (CDC BRFSS 2024, BEA; our calculation)
- Highest: West Virginia 30.2%, Kentucky 28.3%. Lowest: New Jersey 13.3%, Hawaii 14.4% (CDC BRFSS 2024)
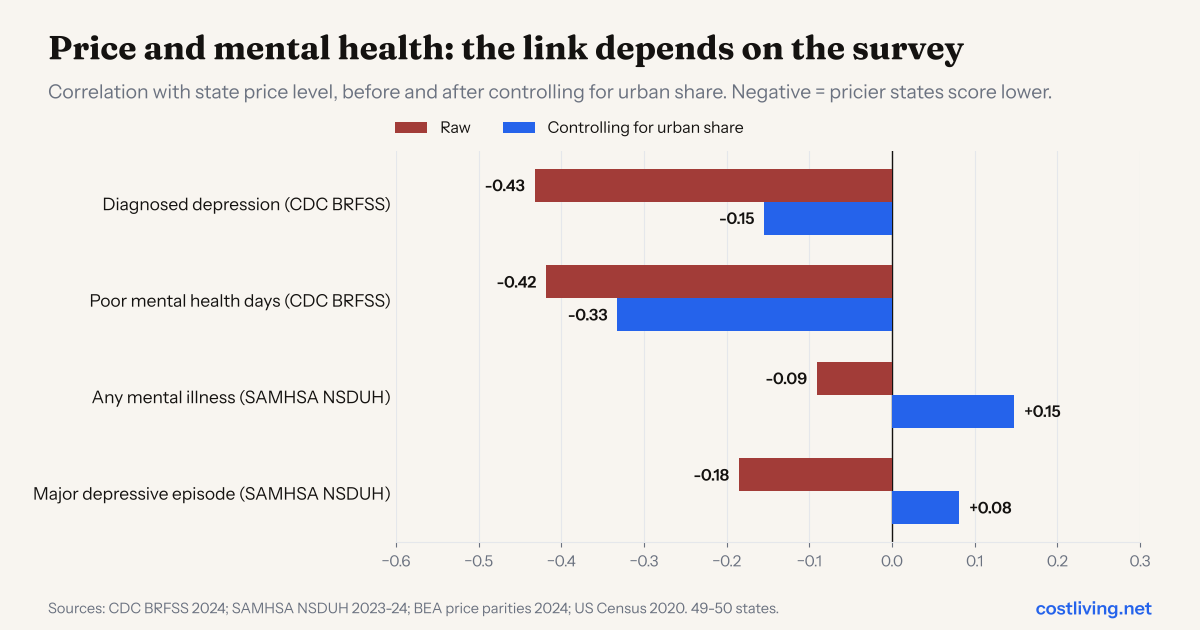
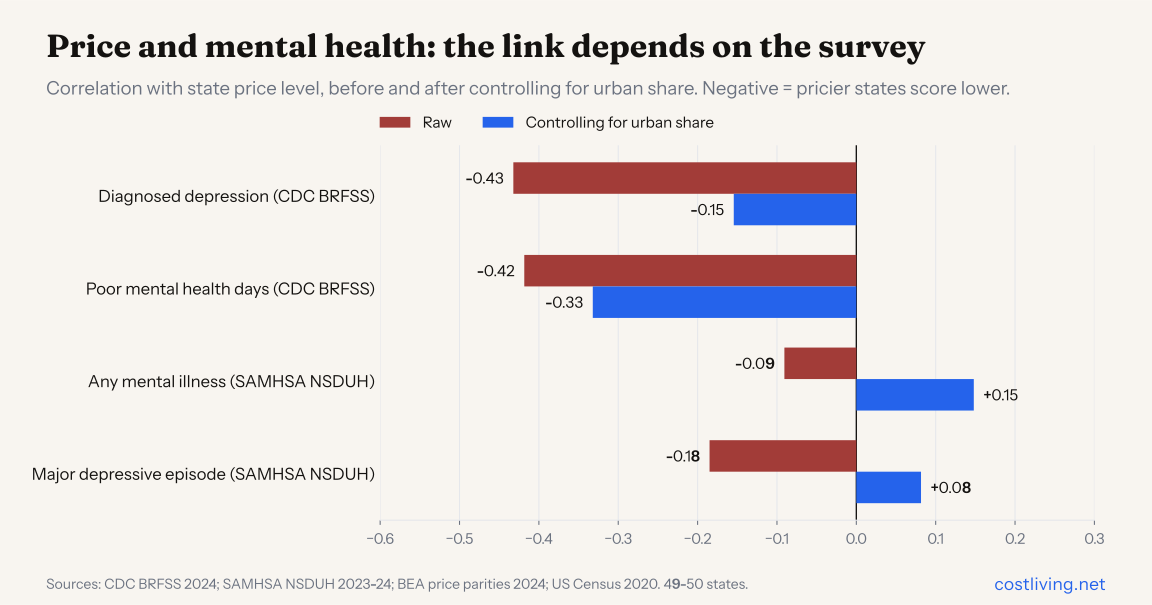
- Correlation of state price level with diagnosed depression: -0.43, falling to -0.15 once urban share is held constant (our calculation)
- Correlation of state price level with SAMHSA’s model-based mental illness rate: -0.09, no link (our calculation)
- Price-adjusted income per head and poor mental health days: -0.44, still -0.37 after holding rural share and prices constant (our calculation)
Money and mood
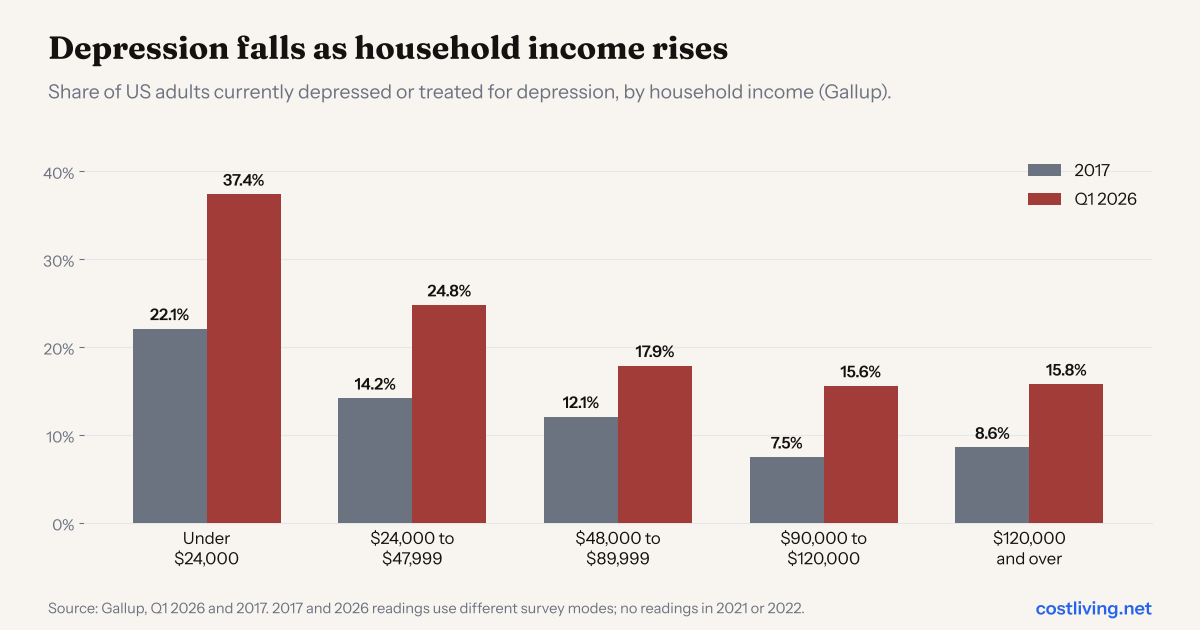
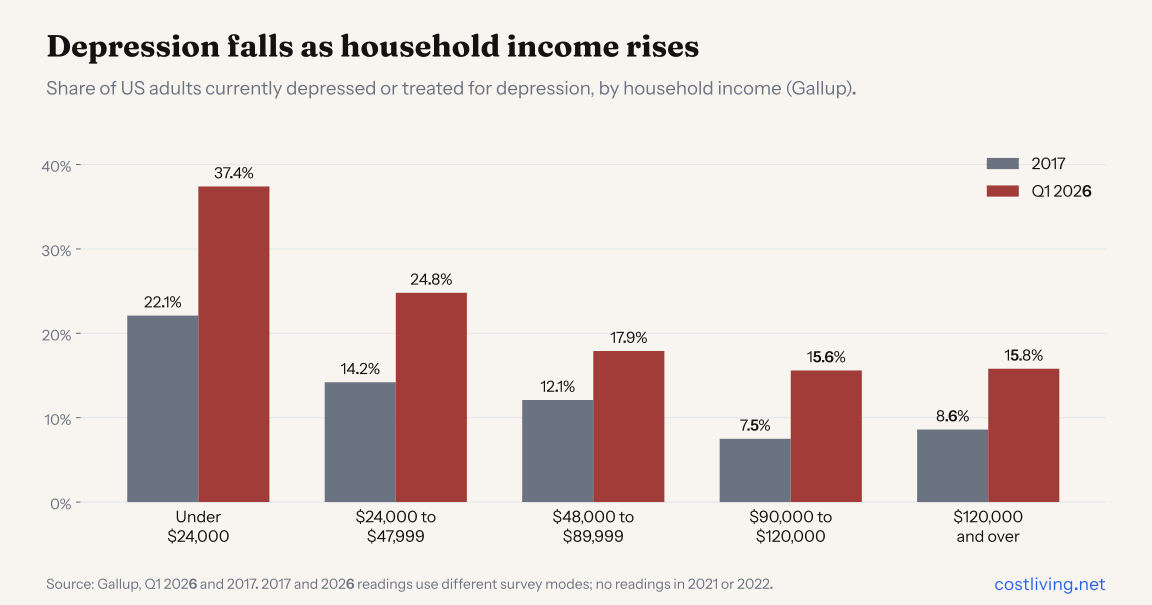
- Gallup depression rate: 37.4% of adults in households earning under $24,000, 15.8% at $120,000 and over (Gallup, Q1 2026)
- Below the poverty line, 22.1% have depression symptoms; at four times the line or more, 7.4% (CDC NHANES)
- 77% of adults cite the cost of living as a significant source of stress (American Psychological Association, 2026)
- 63% of adults could cover a $400 emergency from cash or savings (Federal Reserve)
- Adults with depression were 2.9 times as likely to have medical debt: 27.3% against 9.4% †
Care and cost
- 26.9 million adults with a mental illness, about 49%, received no treatment in 2025 (SAMHSA)
- Among untreated adults who wanted care, 61.4% thought it would cost too much (SAMHSA)
- 5.4% of all adults went without needed mental health care because of cost (CDC NHIS, 2025)
- Psychiatrists per 100,000 people: 20.0 in urban areas, 5.7 in rural areas (WWAMI Rural Health Research Center)
- 7,109 mental health shortage areas covering 157.1 million people (HRSA, June 2026)
- Uninsured rate: 2.8% in Massachusetts, 16.7% in Texas (Census ACS, 2024)
How Many Americans Have Depression?
Between 7.4% and 22.0% of US adults, depending on the survey. The four main measures count different things over different periods, so none is the “real” rate and they cannot be averaged.
| Measure | Figure | Source (period) |
|---|---|---|
| Major depressive episode in the past year, adults 18+ | 7.4% (19.7 million) | SAMHSA, National Survey on Drug Use and Health (2025) |
| Depression symptoms in the past two weeks (PHQ-9 score of 10 or more), ages 12+ | 13.1% | CDC NCHS, NHANES (Aug 2021 to Aug 2023) |
| Currently have or are being treated for depression, adults 18+ | 19.1% | Gallup (18 Feb to 3 Mar 2026) |
| Ever told by a health professional they have a depressive disorder, adults 18+ | 22.0% | CDC BRFSS, via America’s Health Rankings (2024) |
| Ever diagnosed with depression, adults 18+ | 29.5% | Gallup (18 Feb to 3 Mar 2026) |
Source: SAMHSA 2025 Annual National Report (July 2026); CDC NCHS Data Brief 527; Gallup (21 April 2026); America’s Health Rankings. NHANES measures symptoms in an examination survey, so it is not a diagnosis.
Our working: the highest of the first four figures (22.0%) is 3.0 times the lowest (7.4%). The gap is definitional. A lifetime diagnosis counts everyone who has ever had one, while the SAMHSA figure counts only people who met full diagnostic criteria for a two-week episode within the past year.
How common is mental illness overall?
One in five US adults had a mental illness in 2025. SAMHSA counted 54.6 million adults, 20.6%, with any mental illness and 18.2 million, 6.9%, with serious mental illness, the form that substantially limits daily life.
| Measure | Figure | Source (period) |
|---|---|---|
| Adults with any mental illness | 20.6% (54.6 million) | SAMHSA NSDUH (2025) |
| Adults with serious mental illness | 6.9% (18.2 million) | SAMHSA NSDUH (2025) |
| Adults with a major depressive episode and severe impairment | 5.2% (13.8 million) | SAMHSA NSDUH (2025) |
| Adults with moderate or severe generalised anxiety symptoms, past two weeks | 6.6% (17.5 million) | SAMHSA NSDUH (2025) |
| Adults with regular feelings of worry, nervousness or anxiety | 12.5% | CDC NCHS, NHIS Early Release (2025) |
| Adults with regular feelings of depression | 4.5% | CDC NCHS, NHIS Early Release (2025) |
| Adults with frequent mental distress (14 or more poor mental health days in a month) | 15.6% | America’s Health Rankings, from CDC BRFSS (2024) |
Source: SAMHSA 2025 Annual National Report; CDC FastStats and NHIS Early Release of Selected Estimates 2025 (preliminary); America’s Health Rankings. SAMHSA’s mental illness figures come from a statistical model, not a clinical interview.
SAMHSA changed its mental illness model in 2025. Under the new model its 2024 estimate was 21.5%, not the 23.4% originally published, so 2025 figures should not be set against the 2024 report.
Who is most affected?
Young adults, women and people on low incomes report the most depression, in every survey that breaks it down.
| Group | Figure | Source (period) |
|---|---|---|
| Any mental illness, adults 18 to 25 | 28.6% | SAMHSA NSDUH (2025) |
| Any mental illness, adults 26 to 49 | 27.1% | SAMHSA NSDUH (2025) |
| Any mental illness, adults 50 and over | 12.8% | SAMHSA NSDUH (2025) |
| Major depressive episode, adults 18 to 25 | 14.2% | SAMHSA NSDUH (2025) |
| Major depressive episode, adults 50 and over | 4.0% | SAMHSA NSDUH (2025) |
| Major depressive episode, adolescents 12 to 17 | 15.1% | SAMHSA NSDUH (2025) |
| Moderate or severe anxiety symptoms, adolescents 12 to 17 | 18.0% | SAMHSA NSDUH (2025) |
| Persistent sadness or hopelessness, high school students | 40% | CDC Youth Risk Behavior Survey (2023) |
| Persistent sadness or hopelessness, high school girls | 53% | CDC Youth Risk Behavior Survey (2023) |
| Depression symptoms, females 12+ | 16.0% | CDC NCHS, NHANES (Aug 2021 to Aug 2023) |
| Depression symptoms, males 12+ | 10.1% | CDC NCHS, NHANES (Aug 2021 to Aug 2023) |
| Currently depressed or treated, adults 18 to 29 | 28.0% | Gallup (Q1 2026) |
| Currently depressed or treated, adults 65+ | 9.8% | Gallup (Q1 2026) |
Source: SAMHSA 2025 Annual National Report; CDC YRBS 2023; CDC NCHS Data Brief 527; Gallup (21 April 2026). The YRBS question asks about feeling so sad or hopeless almost every day for two weeks that usual activities stopped; it is not a diagnosis.
Our working: Gallup’s rate for adults aged 18 to 29 (28.0%) is 2.9 times its rate for those aged 65 and over (9.8%). In SAMHSA’s data, adults aged 18 to 25 are 2.2 times as likely as those aged 50 and over to have any mental illness (28.6% against 12.8%).
Is mental illness getting worse?
It depends on the survey. Two sources show a rise since the mid-2010s, while SAMHSA’s data show a fall since 2021.
| Measure | Figure | Source (period) |
|---|---|---|
| Depression symptoms, ages 12+ | 8.2% in 2013 to 2014, 13.1% in 2021 to 2023 | CDC NCHS, NHANES |
| Currently depressed or treated, adults | 13.5% in 2017, 19.1% in Q1 2026 (series high 20.0% in Q4 2025) | Gallup |
| Major depressive episode, adults | 8.5% in 2021, 7.4% in 2025 (decreased) | SAMHSA NSDUH |
| Any mental illness, adults 18 to 25 | 33.2% in 2021, 28.6% in 2025 (decreased) | SAMHSA NSDUH |
| Any mental illness, all adults | No change from 2021 to 2025 | SAMHSA NSDUH |
| Major depressive episode, adolescents 12 to 17 | 20.8% in 2021, 15.1% in 2025 (decreased) | SAMHSA NSDUH |
| Persistent sadness or hopelessness, high school students | 42% in 2021, 40% in 2023 | CDC YRBS |
| Lonely “a lot of the day yesterday” | 23% average in 2020 to early 2021, 20% in Feb 2026 | Gallup |
Source: as above. SAMHSA’s trend runs from 2021, when it changed to a mixed in-person and web survey, and it cannot see the earlier rise. Gallup’s 2017 and 2026 readings come from different survey modes, and it took no readings in 2021 or 2022.
Do Expensive States Have Worse Mental Health?
No. Across the 50 states, higher prices go with lower rates of diagnosed depression and fewer poor mental health days in the CDC’s survey, and with no difference in SAMHSA’s model-based estimates. No measure shows pricier states doing worse.
We set BEA’s 2024 regional price parities, which measure how much more or less a state costs than the US average, against four state-level mental health measures from two independent federal surveys. A correlation of -1 would mean mental health is always better where prices are higher, 0 means no relationship and +1 means it is always worse.
| Mental health measure (survey, period) | States | Correlation with price level | 95% range | After holding urban share constant |
|---|---|---|---|---|
| Adults ever told they have depression (CDC BRFSS, 2024) | 49 | -0.43 | -0.66 to -0.12 | -0.15 |
| Adults with poor mental health days (CDC BRFSS, 2024) | 49 | -0.42 | -0.68 to -0.11 | -0.33 |
| Adults with any mental illness (SAMHSA NSDUH, 2023 to 2024) | 50 | -0.09 | -0.41 to +0.24 | +0.15 |
| Adults with a major depressive episode (SAMHSA NSDUH, 2023 to 2024) | 50 | -0.18 | -0.49 to +0.17 | +0.08 |
Source: CostLiving calculation from BEA Regional Price Parities, all items (2024), CDC BRFSS Mental Health Indicators (2024), SAMHSA 2023-2024 NSDUH state estimates (model-based) and the 2020 Census. Pearson correlation, 95% ranges from 10,000-sample bootstrap. Tennessee has no 2024 BRFSS data; DC is excluded.
Our working: the first two lines are statistically significant before controlling for rural share (p = 0.002 and 0.003); the SAMHSA lines are not (p = 0.53 and 0.20). After holding urban share constant, diagnosed depression drops to -0.15 (p = 0.30) and poor mental health days to -0.33 (p = 0.02). The two CDC measures agree with each other (correlation 0.67), and the two SAMHSA measures agree closely with each other (0.91), but the two surveys agree only partly (0.65 for diagnosed depression against SAMHSA’s mental illness rate).
What do the ten priciest and ten cheapest states look like?
The ten priciest states report diagnosed depression at 18.5% against 23.4% in the ten cheapest, a gap of nearly five points. On SAMHSA’s measures the gap is under one point.
| Measure | 10 priciest states | 10 cheapest states | Source (period) |
|---|---|---|---|
| Price level (US = 100), average | 106.6 | 88.4 | BEA (2024) |
| Told they have depression | 18.5% | 23.4% | CDC BRFSS (2024) |
| Poor mental health days | 14.3% | 16.6% | CDC BRFSS (2024) |
| Any mental illness | 22.9% | 23.8% | SAMHSA NSDUH (2023 to 2024) |
| Major depressive episode | 8.2% | 8.8% | SAMHSA NSDUH (2023 to 2024) |
| Urban share of population | 85.8% | 59.4% | US Census Bureau (2020) |
Source: CostLiving calculation. Priciest: California, Hawaii, New Jersey, New York, Washington, Massachusetts, Maryland, New Hampshire, Connecticut, Florida. Cheapest: Arkansas, Mississippi, Iowa, Oklahoma, Louisiana, South Dakota, Alabama, North Dakota, West Virginia, Kansas. Simple averages of state values, not population-weighted.
The last row is the catch. The priciest ten are 85.8% urban and the cheapest ten 59.4%, and rural states report more diagnosed depression in the CDC data (see below).
Which states report the most and the least depression?
West Virginia has the highest rate of diagnosed depression at 30.2% and New Jersey the lowest at 13.3%, a gap of more than two to one.
| Highest: state | Told they have depression | Lowest: state | Told they have depression |
|---|---|---|---|
| West Virginia | 30.2% | New Jersey | 13.3% |
| Kentucky | 28.3% | Hawaii | 14.4% |
| Oregon | 27.3% | New York | 15.9% |
| Michigan | 26.7% | California | 17.8% |
| Maine | 26.7% | Florida | 17.9% |
Source: CDC BRFSS Mental Health Indicators (2024), adults who have ever been told they have a depressive disorder. Michigan and Maine tie for fourth highest. 49 states; Tennessee did not collect enough data.
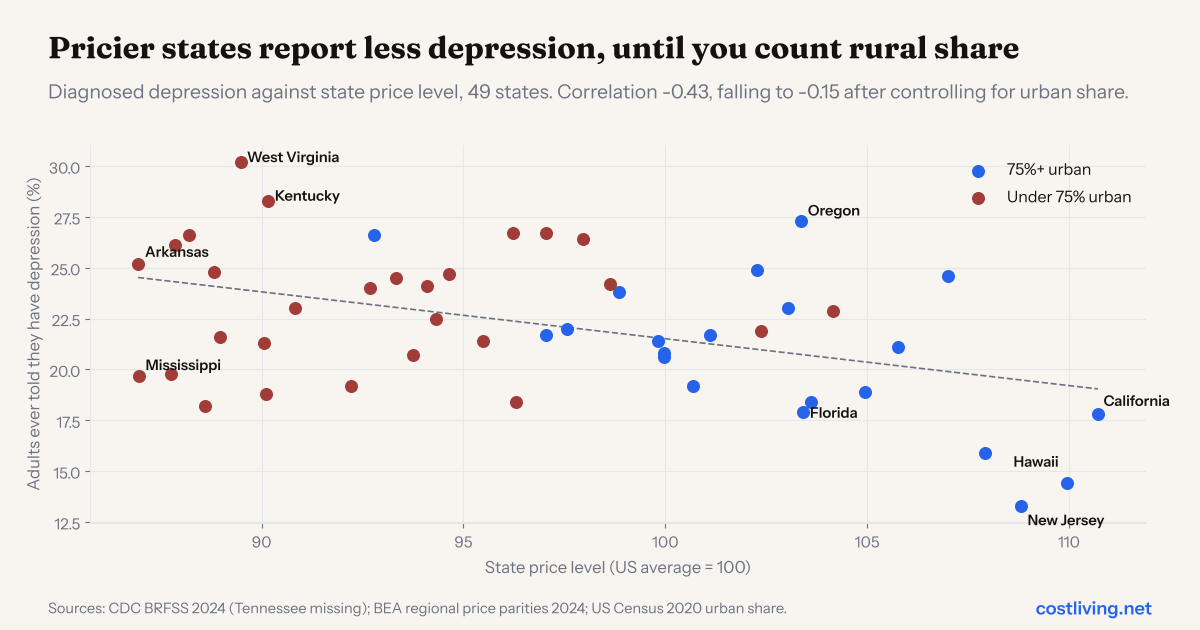
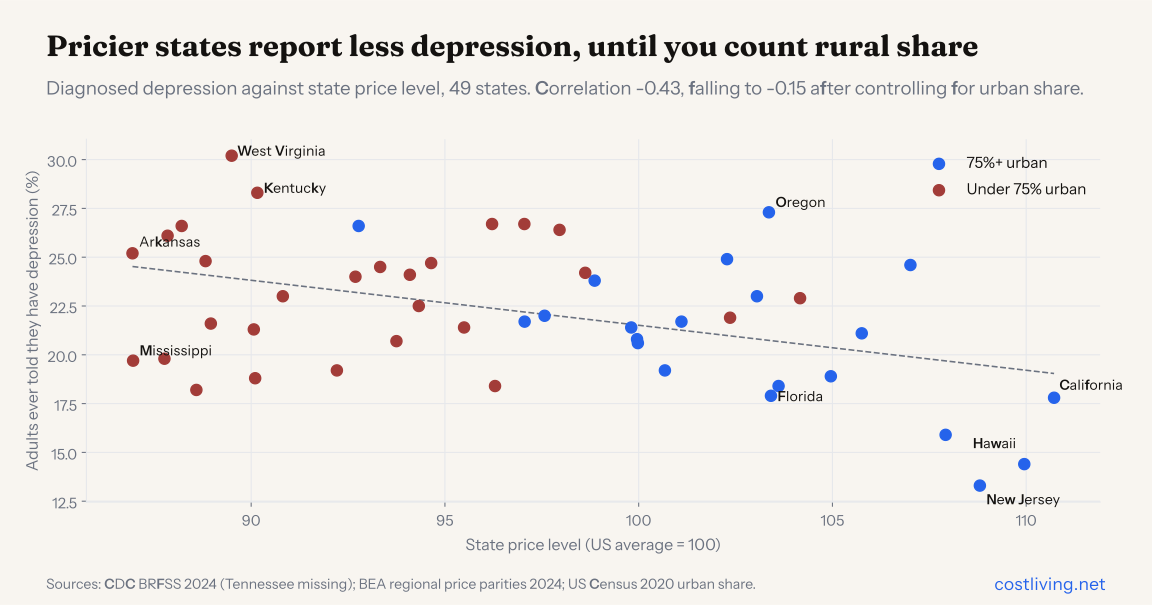
Our working: West Virginia’s rate (30.2%) is 2.3 times New Jersey’s (13.3%). West Virginia is 44.6% urban with prices 10.5 points below the US level; New Jersey is 93.8% urban with prices 8.8 points above it. SAMHSA’s model also puts New Jersey lowest for any mental illness (18.1%), but West Virginia third highest (28.1%), behind Oregon (31.6%) and Vermont (29.1%).
The range of price levels is wide too. California (110.7) is 27% more expensive than Arkansas (86.9), and its housing is 2.8 times as expensive as West Virginia’s (154.3 against 54.2, BEA housing price parities).
Is It Prices, Rural Life or Income?
Rural share explains much of the pattern. Pricier states are more urban (correlation +0.65), and urbanity on its own tracks lower diagnosed depression (-0.51) and lower SAMHSA mental illness (-0.30).
| Measure | Figure | Source (period) |
|---|---|---|
| Correlation, state price level and urban share | +0.65 | CostLiving calculation; BEA (2024), Census (2020) |
| Correlation, urban share and diagnosed depression | -0.51 | CostLiving calculation; CDC BRFSS (2024) |
| Correlation, urban share and SAMHSA any mental illness | -0.30 | CostLiving calculation; SAMHSA (2023 to 2024) |
| Correlation, urban share and SAMHSA major depressive episode | -0.37 | CostLiving calculation; SAMHSA (2023 to 2024) |
| Diagnosed depression, nonmetropolitan adults | 22.3% (2023); 23.5% (2024) | America’s Health Rankings, from CDC BRFSS |
| Diagnosed depression, metropolitan adults | 19.8% (2023) | America’s Health Rankings, from CDC BRFSS |
| Share of population living in rural areas, US | 20.0% | US Census Bureau (2020) |
| Most rural state: Vermont | 64.9% rural | US Census Bureau (2020) |
| Most urban states: California, Nevada | 94.2%, 94.1% urban | US Census Bureau (2020) |
Source: as listed. America’s Health Rankings reports that nonmetropolitan adults were 1.13 times as likely as metropolitan adults to report diagnosed depression in 2023. Census urban share (2020) is used in all of our state calculations.
Our working: holding urban share constant cuts the link between price and diagnosed depression from -0.43 to -0.15. It does not reach zero everywhere. Among the 21 states that are at least 75% urban, price and diagnosed depression stay strongly linked (-0.62); among the 28 less urban states with data they are not linked at all (+0.03). The 75% cut-off is ours and the split was run after seeing the data, so treat it as a lead rather than a finding.
Does Income Matter More Than Prices?
Slightly, for frequent poor mental health. After adjusting for local prices, higher incomes go with fewer poor mental health days (-0.44, against -0.42 for price level), and the link holds up better once rural share is held constant (-0.41, against -0.33 for price level). For diagnosed depression and SAMHSA’s estimates, income shows little or no link.
| Measure | Figure | Source (period) |
|---|---|---|
| Correlation, price-adjusted income per head and poor mental health days | -0.44 | CostLiving calculation; BEA, CDC BRFSS |
| Same, holding urban share and price level constant | -0.37 | CostLiving calculation |
| Correlation, price-adjusted income per head and loneliness (34 states) | -0.46 | CostLiving calculation; CDC BRFSS optional module |
| Correlation, price-adjusted income per head and diagnosed depression | -0.24 (not significant) | CostLiving calculation |
| Correlation, price-adjusted income per head and SAMHSA mental illness | -0.01 | CostLiving calculation |
| Correlation, price-adjusted income per head and SAMHSA treatment received | +0.26 | CostLiving calculation |
| Real per-capita income, highest: Wyoming | $75,501 | BEA (2024, constant 2017 dollars, price-adjusted) |
| Real per-capita income, lowest: Mississippi | $48,465 | BEA (2024, constant 2017 dollars, price-adjusted) |
| US real per-capita income | $59,195 | BEA (2024, constant 2017 dollars) |
Source: BEA Real Personal Income for States (2024), CDC BRFSS (2024), SAMHSA (2023 to 2024; treatment 2024). Real income here is per-capita personal income in 2017 dollars, adjusted for each state’s price level. “Loneliness” is the BRFSS optional-module question “How often do you feel lonely?”; the dataset does not give the response threshold behind the percentage.
Our working: the highest real income (Wyoming) is 1.56 times the lowest (Mississippi). Holding rural share and price level constant, states with higher real incomes have higher treatment rates (+0.35, p = 0.014) but no lower rates of mental illness. That may reflect access to care, though the data cannot show it.
How does income relate to depression for individuals?
Sharply, in both main US sources. Gallup’s depression rate is 37.4% for adults in households earning under $24,000 and 15.8% for those earning $120,000 or more.
| Household income | Gallup: currently depressed or treated (Q1 2026) | CDC NHANES: depression symptoms (2021 to 2023) |
|---|---|---|
| Lowest band | 37.4% (under $24,000) | 22.1% (below the poverty line) |
| Second band | 24.8% ($24,000 to $47,999) | 19.2% (100% to under 200% of poverty) |
| Third band | 17.9% ($48,000 to $89,999) | 13.1% (200% to under 400% of poverty) |
| Fourth band | 15.6% ($90,000 to $120,000) | 7.4% (400% of poverty or more) |
| Highest band | 15.8% ($120,000 and over) | n/a |
Source: Gallup (21 April 2026); CDC NCHS Data Brief 527. The two surveys use different income bands and different depression measures. NHANES covers ages 12 and over, and 11.9% of respondents had no income recorded.
Our working: Gallup’s lowest band is 2.4 times its highest (37.4% against 15.8%); in NHANES, people below the poverty line are 3.0 times as likely as those at four times the line or more to have depression symptoms (22.1% against 7.4%). Gallup’s lowest band was at 22.1% in 2017 and its highest at 8.6%, so the gap in points has grown from 13.5 to 21.6 even though the ratio has narrowed from 2.6 to 2.4. Gallup’s 2017 and 2026 readings come from different survey modes.
How Many Americans Are Struggling With Everyday Costs?
A majority say prices have hurt them. In October 2025, 58% of adults told the Federal Reserve that price changes had made their financial situation worse, down from 60% in 2024 and 65% in 2023.
| Measure | Figure | Source (period) |
|---|---|---|
| Adults who could cover a $400 emergency with cash or equivalent | 63% | Federal Reserve SHED (Oct 2025) |
| Adults doing at least okay financially | 73% | Federal Reserve SHED (Oct 2025) |
| Adults saying price changes made their finances worse | 58% | Federal Reserve SHED (Oct 2025) |
| Adults who struggled to pay bills in the prior month | 28% | Federal Reserve SHED (Oct 2025) |
| Adults with at least one major unexpected expense in the past year | 59% | Federal Reserve SHED (Oct 2025) |
| Renters behind on rent at some point in the past year | 23% | Federal Reserve SHED (Oct 2025) |
| Adults who skipped medical care because of cost | 26% | Federal Reserve SHED (Oct 2025) |
| Adults citing cost of living as a significant source of stress | 77% | American Psychological Association (Jul to Aug 2026) |
| Adults who feel they are doing everything right but still falling behind | 59% | American Psychological Association (Jul to Aug 2026) |
| Adults worried they cannot afford necessary healthcare in the coming year | 47% | Gallup and West Health (Jun to Aug 2025) |
| Renter households spending more than 30% of income on housing | 22.7 million (49.4%) | Congressional Research Service, from ACS (2024) |
| Owner households spending more than 30% of income on housing | 20.7 million (23.9%) | Congressional Research Service, from ACS (2024) |
| Consumer prices, 12 months to September 2026 | +3.7% | BLS (Sep 2026) |
| Unemployment rate | 4.2% | BLS (Sep 2026) |
| Median household income | $87,460 (2025 dollars) | US Census Bureau (2025) |
Source: Federal Reserve Economic Well-Being of US Households in 2025 (May 2026); APA Stress in America 2026 (Harris Poll, n = 3,132, online); Gallup and West Health (n = 19,535); CRS R48945 (13 May 2026); BLS CPI and Employment Situation (Sep 2026); Census Bureau P60-289. The APA release does not tie the “doing everything right” item to money. The cost-burden counts will be replaced by 2025 ACS figures due 29 October 2026.
Our working: the same households can say they are fine and under strain at once, because the questions differ. 73% describe their finances as at least okay, yet 58% say prices have hurt them and 77% call cost of living a significant stressor. The Federal Reserve survey was fielded in October 2025 and the APA survey in July and August 2026. US consumer prices were 3.7% higher in September 2026 than a year earlier; the oil and fuel price rises behind part of that are covered in CostLiving’s War and the Cost of Living statistics.
Does Money Stress Cause Depression, or the Other Way Round?
Both, probably, and most US data cannot tell them apart. The strongest causal evidence comes from experiments, and it is small: anti-poverty programmes raised mental health scores by 0.09 standard deviations across 30 randomised trials, all in low- or middle-income countries.
| Measure | Figure | Source (period) |
|---|---|---|
| Effect of anti-poverty programmes on mental health, 30 randomised trials | +0.094 standard deviations (95% range 0.040 to 0.147) | Ridley, Rao, Schilbach and Patel, NBER and Science (2020) |
| Effect of cash transfers alone | +0.067 standard deviations | Ridley and co-authors (2020) |
| Effect of multi-faceted programmes | +0.138 standard deviations | Ridley and co-authors (2020) |
| Unemployment and mental health, average partial correlation across 327 study results | -0.048 | Picchio and Ubaldi, Journal of Economic Surveys (studies 1990 to 2021) |
| Unemployment and all health outcomes, same studies | -0.033 | Picchio and Ubaldi (2023) |
| Adults with current depression who had medical debt | 27.3% † | Johns Hopkins summary of Moon and co-authors, JAMA Psychiatry (NHIS 2022) |
| Adults without current depression who had medical debt | 9.4% † | Same |
| Adults with current anxiety who had medical debt | 26.2% † | Same |
| Adults with depression and medical debt who delayed mental health care | 36.9% † | Same |
| Adults with depression and no medical debt who delayed mental health care | 17.4% † | Same |
Source: NBER Working Paper 27157 (May 2020, revised November 2020); Picchio and Ubaldi, DOI 10.1111/joes.12588; Johns Hopkins Bloomberg School of Public Health (July 2024), summarising a paper we did not open. The medical debt figures are cross-sectional and do not show which came first.
Our working: adults with current depression were 2.9 times as likely to have medical debt as adults without (27.3% against 9.4%). The unemployment effect is small; the authors call it “quite small”, although mental health was the health domain they found most affected.
The Gallup, NHANES and medical debt figures above are correlations. Depression can reduce earnings, and poverty can produce depression, so none should be read as money causing illness.
Can Americans Afford Mental Health Care?
Not always. Of the 26.9 million adults with a mental illness who received no treatment in 2025, 21.4% (5.6 million) said they wanted or thought they should get help, and 61.4% of those said it would cost too much.
| Measure | Figure | Source (period) |
|---|---|---|
| Adults with any mental illness who received treatment | 50.9% (27.8 million) | SAMHSA NSDUH (2025) |
| Adults with any mental illness who received no treatment | 26.9 million | SAMHSA NSDUH (2025) |
| Untreated adults with a perceived unmet need | 21.4% (5.6 million) | SAMHSA NSDUH (2025) |
| Of those, said treatment would cost too much | 61.4% | SAMHSA NSDUH (2025) |
| Of those, said insurance did not pay enough | 40.3% | SAMHSA NSDUH (2025) |
| Of those, had no insurance cover for mental health treatment | 39.0% | SAMHSA NSDUH (2025) |
| Of those, did not know how or where to get treatment | 44.9% | SAMHSA NSDUH (2025) |
| Of those, could not find a professional they wanted | 43.2% | SAMHSA NSDUH (2025) |
| All adults who did not get needed mental health care due to cost | 5.4% | CDC NCHS, NHIS Early Release (2025) |
| All adults who skipped mental health care or counselling due to cost | 10% | Federal Reserve SHED (Oct 2025) |
| Insured adults who did not get needed mental health care and said they could not afford it | 44% | KFF (Dec 2024) |
| Adults with serious mental illness who received no treatment | 5.9 million | SAMHSA NSDUH (2025) |
| Adults who received counselling or therapy | 14.0% | CDC NCHS Data Brief 564 (2024) |
| Adults who took mental health medication | 19.3% | CDC NCHS Data Brief 564 (2024) |
| Adults with any mental illness who used telehealth | 32.8% (17.9 million) | SAMHSA NSDUH (2025) |
Source: SAMHSA 2025 Annual National Report; CDC NHIS Early Release 2025 (preliminary, released May 2026); Federal Reserve SHED; KFF column by Drew Altman; CDC NCHS Data Brief 564 (June 2026). SAMHSA warns that the reasons for not getting care should not be ranked, as differences between them are not necessarily significant.
Our working: the cost figures differ by a factor of ten across sources because the groups differ. 5.4% is of all adults, 44% of insured adults who went without care, and 61.4% of untreated adults with a mental illness who wanted help. Do not read 61.4% as the share of people with a mental illness who skip care because of cost. About 49% of adults with a mental illness (26.9 of 54.6 million) got no treatment, but only about one in five of those said they wanted it.
What does mental health care cost?
Privately insured adults treated for depression or anxiety paid $1,501 out of pocket in 2021, against $863 for adults with no mental health diagnosis. No federal or peer-reviewed source gives an average price per session.
| Measure | Figure | Source (period) |
|---|---|---|
| Average annual out-of-pocket cost, psychiatric office visits | $128 | Peterson-KFF Health System Tracker (2021 claims) |
| Average annual out-of-pocket cost, other mental health office visits | $96 | Peterson-KFF Health System Tracker (2021 claims) |
| Annual out-of-pocket spending, people treated for depression or anxiety | $1,501 | Peterson-KFF Health System Tracker (2021 claims) |
| Annual out-of-pocket spending, people with no mental health diagnosis | $863 | Peterson-KFF Health System Tracker (2021 claims) |
| Average out-of-pocket cost per visit, high cost-burden adults | $117 | Gao and Olfson, Psychiatric Services (MEPS 2018 to 2021) |
| Average out-of-pocket cost per visit, low cost-burden adults | $38 | Gao and Olfson, Psychiatric Services (MEPS 2018 to 2021) |
| Annual out-of-pocket cost, high cost-burden adults | $3,670 | Gao and Olfson, Psychiatric Services (MEPS 2018 to 2021) |
| Patients going out of network for psychiatrists, relative to medical or surgical specialists | 8.9 times as often | RTI International (claims 2019 to 2021) |
| Patients going out of network for psychologists | 10.6 times as often | RTI International (claims 2019 to 2021) |
| Mental health facilities participating with Medicaid | 85% | KFF, from SAMHSA N-SUMHSS (2024) |
| Mental health facilities participating with private insurance | 83% | KFF, from SAMHSA N-SUMHSS (2024) |
| Mental health facilities participating with Medicare | 64% | KFF, from SAMHSA N-SUMHSS (2024) |
| Share of adults with mental illness covered by Medicaid | Nearly one third | KFF (May 2026) |
Source: Peterson-KFF Health System Tracker (23 June 2023), non-elderly adults on large-employer insurance, claims only; Gao and Olfson, Psychiatric Services 76(2):200 to 203 (8,923 adults, high burden means out-of-pocket costs of at least 10% of disposable income); RTI International (commissioned by a foundation and part-funded by US psychiatric and psychological associations); KFF. “High cost-burden” figures are group means, not typical prices. Participation does not mean accepting new patients.
Where Is Mental Health Care Hardest to Reach?
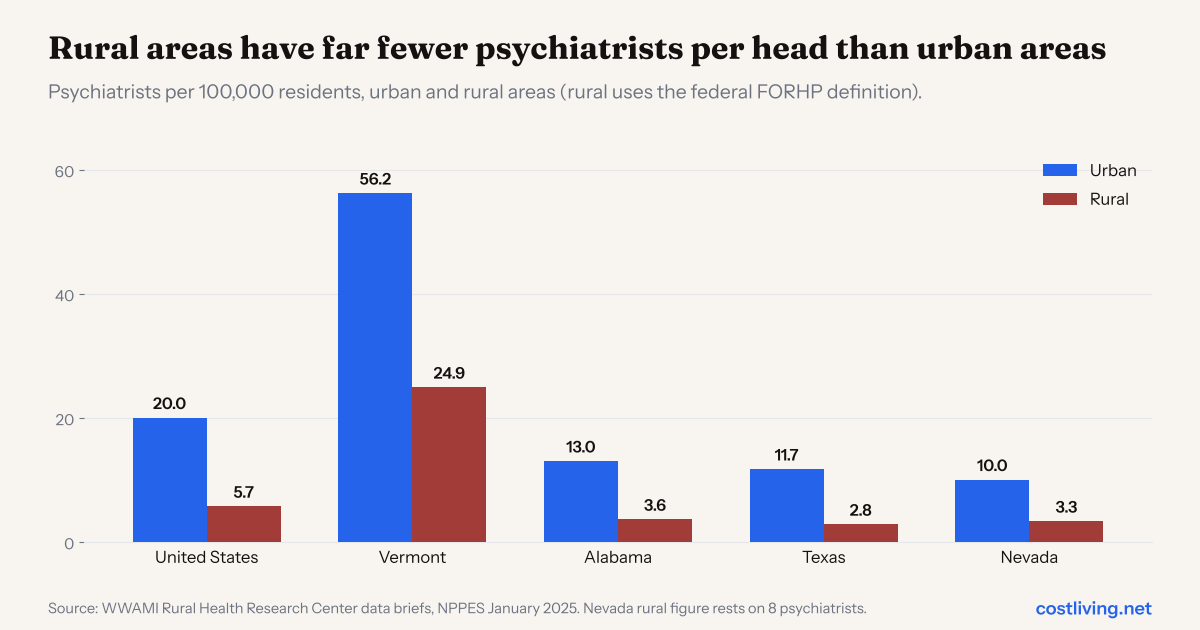
In rural areas, and in Alabama, Texas and South Carolina, which rank bottom in Mental Health America’s access ranking. Rural parts of the US have 5.7 psychiatrists per 100,000 people against 20.0 in urban parts.
| Measure | Figure | Source (period) |
|---|---|---|
| Mental health professional shortage areas | 7,109 | HRSA (30 Jun 2026) |
| People living in those areas | 157.1 million | HRSA (30 Jun 2026) |
| Share of need met in those areas | 26.53% | HRSA (30 Jun 2026) |
| Rural designations | 4,295 (60.42%) | HRSA (30 Jun 2026) |
| Psychiatrists per 100,000, US | 17.7 (60,061) | WWAMI Rural Health Research Center (NPPES, Jan 2025) |
| Psychiatrists per 100,000, urban | 20.0 | WWAMI RHRC |
| Psychiatrists per 100,000, rural | 5.7 | WWAMI RHRC |
| Psychologists per 100,000, urban and rural | 43.1; 15.9 | WWAMI RHRC |
| Rural v urban psychiatrists per 100,000: Vermont | 24.9 v 56.2 | WWAMI RHRC |
| Rural v urban psychiatrists per 100,000: Alabama | 3.6 v 13.0 | WWAMI RHRC |
| Rural v urban psychiatrists per 100,000: Texas | 2.8 v 11.7 | WWAMI RHRC |
| Rural v urban psychiatrists per 100,000: Nevada | 3.3 v 10.0 | WWAMI RHRC |
| Counties with no psychologist: rural v urban | 45% v 16% | HRSA (2021 data) |
| Residents per mental health provider, US | 320 | Mental Health America (2024 data) |
| Access to care ranking: top three | Vermont, Maine, Massachusetts | Mental Health America (2025 edition) |
| Access to care ranking: bottom three | Alabama (51), Texas (50), South Carolina (49) | Mental Health America (2025 edition) |
| Projected adult psychiatrist shortfall, 2038 | 36,780 (50% of demand met) | HRSA NCHWA (Dec 2025) |
| Projected psychologist shortfall, 2038 | 99,840 (48% of demand met) | HRSA NCHWA (Dec 2025) |
| Uninsured rate, US, all residents | 8.2% | US Census Bureau, ACS (2024) |
| Uninsured rate, US, uninsured for the whole year | 7.9% (26.7 million) | US Census Bureau, CPS ASEC (2025) |
| Uninsured rate, Massachusetts and Texas | 2.8%; 16.7% | US Census Bureau, ACS (2024) |
Source: HRSA Designated HPSA Quarterly Summary; WWAMI Rural Health Research Center data briefs (2025 to 2026); HRSA National Center for Health Workforce Analysis, State of the Behavioral Health Workforce (2025); Mental Health America, State of Mental Health in America 2025; Census Bureau ACS Brief 24 and P60-291. Rural uses the federal Office of Rural Health Policy definition in the WWAMI data. The HRSA population count can include people in overlapping designations. KFF reported 137.1 million people in shortage areas as of December 2025; we did not find HRSA’s explanation for the rise to 157.1 million. The ACS 2025 state figures are due 29 October 2026.
Our working: rural psychiatrist density (5.7) is 28.5% of urban (20.0), under a third. The gap between states is larger than the gap between rural and urban areas within them: rural Vermont has 24.9 psychiatrists per 100,000, nearly twice as many as urban Alabama (13.0), and 6.9 times as many as rural Alabama (3.6). Texas’s uninsured rate (16.7%) is six times Massachusetts’s (2.8%). Nevada’s rural figures rest on only 8 psychiatrists.
Mental Health and Cost of Living in Every State
All 50 states, sorted from the highest price level to the lowest. Click a state for its cost of living page.
| State | Price level (US = 100) | Told they have depression | Poor mental health days | Any mental illness (SAMHSA) | Urban share |
|---|---|---|---|---|---|
| California | 110.7 | 17.8% | 14.9% | 21.6% | 94.2% |
| Hawaii | 110.0 | 14.4% | 12.6% | 19.8% | 86.1% |
| New Jersey | 108.8 | 13.3% | 13.2% | 18.1% | 93.8% |
| New York | 107.9 | 15.9% | 14.2% | 21.9% | 87.4% |
| Washington | 107.0 | 24.6% | 16.3% | 27.9% | 83.4% |
| Massachusetts | 105.8 | 21.1% | 13.3% | 24.9% | 91.3% |
| Maryland | 105.0 | 18.9% | 14.2% | 22.7% | 85.6% |
| New Hampshire | 104.2 | 22.9% | 15.0% | 27.7% | 58.3% |
| Connecticut | 103.6 | 18.4% | 13.9% | 23.7% | 86.3% |
| Florida | 103.4 | 17.9% | 15.6% | 20.8% | 91.5% |
| Oregon | 103.4 | 27.3% | 19.0% | 31.6% | 80.5% |
| Colorado | 103.1 | 23.0% | 15.2% | 26.4% | 86.0% |
| Alaska | 102.4 | 21.9% | 15.7% | 24.0% | 64.9% |
| Rhode Island | 102.3 | 24.9% | 14.5% | 25.8% | 91.1% |
| Virginia | 101.1 | 21.7% | 15.7% | 23.1% | 75.6% |
| Arizona | 100.7 | 19.2% | 14.2% | 24.6% | 89.3% |
| Nevada | 100.0 | 20.6% | 18.1% | 24.6% | 94.1% |
| Illinois | 100.0 | 20.8% | 13.0% | 22.2% | 86.9% |
| Delaware | 99.8 | 21.4% | 16.1% | 22.1% | 82.6% |
| Utah | 98.9 | 23.8% | 15.5% | 26.7% | 89.8% |
| Minnesota | 98.6 | 24.2% | 14.0% | 22.6% | 71.9% |
| Vermont | 98.0 | 26.4% | 15.1% | 29.1% | 35.1% |
| Pennsylvania | 97.6 | 22.0% | 16.0% | 23.9% | 76.5% |
| Texas | 97.1 | 21.7% | 15.7% | 20.7% | 83.7% |
| Maine | 97.0 | 26.7% | 16.4% | 26.7% | 38.6% |
| Georgia | 96.3 | 18.4% | 16.1% | 25.2% | 74.1% |
| Michigan | 96.2 | 26.7% | 17.0% | 23.6% | 73.5% |
| Idaho | 95.5 | 21.4% | 15.6% | 24.5% | 69.2% |
| Montana | 94.6 | 24.7% | 16.3% | 25.6% | 53.4% |
| North Carolina | 94.3 | 22.5% | 14.7% | 21.4% | 66.7% |
| Wisconsin | 94.1 | 24.1% | 17.2% | 24.6% | 67.1% |
| South Carolina | 93.7 | 20.7% | 15.2% | 19.8% | 67.9% |
| Indiana | 93.3 | 24.5% | 16.9% | 25.3% | 71.2% |
| Ohio | 92.8 | 26.6% | 17.0% | 23.9% | 76.3% |
| Wyoming | 92.7 | 24.0% | 15.4% | 24.7% | 62.0% |
| New Mexico | 92.2 | 19.2% | 18.2% | 23.9% | 74.5% |
| Tennessee | 91.9 | n/a | n/a | 27.0% | 66.2% |
| Missouri | 90.8 | 23.0% | 17.5% | 25.7% | 69.5% |
| Kentucky | 90.2 | 28.3% | 18.4% | 25.3% | 58.7% |
| Nebraska | 90.1 | 18.8% | 13.4% | 24.1% | 73.0% |
| Kansas | 90.1 | 21.3% | 15.9% | 23.7% | 72.3% |
| West Virginia | 89.5 | 30.2% | 19.3% | 28.1% | 44.6% |
| North Dakota | 89.0 | 21.6% | 12.6% | 23.0% | 61.0% |
| Alabama | 88.8 | 24.8% | 18.0% | 23.0% | 57.7% |
| South Dakota | 88.6 | 18.2% | 13.8% | 21.8% | 57.2% |
| Louisiana | 88.2 | 26.6% | 19.8% | 24.1% | 71.5% |
| Oklahoma | 87.8 | 26.1% | 18.6% | 22.6% | 64.6% |
| Iowa | 87.8 | 19.8% | 14.9% | 25.0% | 63.2% |
| Mississippi | 87.0 | 19.7% | 13.5% | 20.4% | 46.3% |
| Arkansas | 86.9 | 25.2% | 19.9% | 26.6% | 55.5% |
Source: BEA Regional Price Parities, all items (2024; US = 100); CDC BRFSS Mental Health Indicators (2024); SAMHSA 2023-2024 NSDUH state estimates, adults 18+, model-based; US Census Bureau 2020 urban share. n/a means no data; Tennessee did not collect enough 2024 BRFSS data. Full data, with confidence intervals, in the downloadable CSV.
How to Read These Numbers
- Four depression figures. NSDUH measures a past-year episode, NHANES two weeks of symptoms, Gallup current or treated depression and BRFSS a lifetime diagnosis. They are not comparable and none is the true rate.
- Diagnosis depends on care. BRFSS asks whether a health professional has ever said you have depression. Places where people see clinicians less often can report less diagnosed depression than they have. SAMHSA’s state estimates do not rely on a diagnosis.
- Model-based state estimates. SAMHSA’s state figures are hierarchical Bayesian model estimates pooled across 2023 and 2024 (treatment: 2024 only), not direct counts. Small states borrow strength from others, rank order does not imply a significant difference, and the national total for these tables (23.1%) uses SAMHSA’s old mental illness model, so it should not be set against the 20.6% 2025 figure.
- Poor mental health days. The CDC state dataset asks how many of the past 30 days mental health was “not good”. The dataset record does not state the cut-off or age adjustment behind the percentage. America’s Health Rankings, using the same question, reports 15.6% nationally for 14 or more days. We label it “poor mental health days”.
- States are not people. A state-level correlation says nothing about any individual. A pricey state might have wealthier residents who report less depression, or the reverse. This is the ecological fallacy, and it applies to every correlation here.
- Association, not cause. Price level, rural share and income move together. Our controls are limited to the variables listed and the 50 data points give wide ranges.
- Price level is not your bill. BEA’s regional price parities compare the price of a typical basket across states for 2024 and say nothing about what any household pays. CostLiving’s own state pages use a different index (MERIC/C2ER) and household budget, so figures can differ. DC is excluded from the 50-state analysis.
- Rural definitions. The Census urban/rural split (2020), the metropolitan/nonmetropolitan split (BRFSS) and the federal Office of Rural Health Policy definition (WWAMI) are different classifications.
- NSDUH changes. SAMHSA introduced a new mental illness model in 2025 and does not test 2024 against 2025. National 2025 figures here do not compare with the old-model 2023-24 state estimates.
- Survey response. BRFSS 2024 had a median response rate of 43.9% and the NSDUH 2025 report has an overall rate of 8.5%.
- Preliminary data. NHIS 2025 early-release figures are before final editing and weighting.
- † Secondary source. The medical debt figures come from a Johns Hopkins summary of a JAMA Psychiatry paper; we did not open the paper.
Conclusion
Expensive states do not have worse mental health. If anything, the CDC’s diagnosed depression and poor mental health day figures run lower in pricier states, and SAMHSA’s estimates show no difference, but the pattern shrinks or disappears once rural share is controlled for, and the two surveys disagree. What does show up consistently is the role of income and access: lower-income adults report much more depression, price-adjusted income tracks frequent poor mental health across states, and about half of adults with a mental illness got no treatment. Cost is one reason for not getting care, but only one in five of the untreated say they wanted it. Rural areas have the thinnest supply of psychiatrists, and Alabama, Texas and South Carolina rank lowest for access. As SAMHSA, the CDC, Gallup and the Federal Reserve publish their next releases and BEA updates its price parities in December, these figures will move.
Sources
SAMHSA, 2025 NSDUH Annual National Report (Jul 2026); 2024 NSDUH Annual National Report (Jul 2025); 2023-2024 NSDUH state prevalence estimates and small area estimation guide · CDC NCHS, Data Briefs 527, 528, 564; NHIS Early Release of Selected Estimates 2025; FastStats · CDC BRFSS, Mental Health Indicators (data.cdc.gov 5eh7-pjx8), 2024 Overview and Data Quality Report · CDC, Youth Risk Behavior Survey 2023 · America’s Health Rankings (United Health Foundation), 2025 Annual Report measures · Gallup, depression (21 Apr 2026); loneliness; West Health-Gallup (2025) · KFF, column (10 Dec 2024), HPSA state indicator, facility participation indicator, Medicaid brief (13 May 2026), KFF/CNN survey (2022) · Federal Reserve Board, Economic Well-Being of US Households in 2025 (May 2026) · American Psychological Association, Stress in America 2026 · BEA, Regional Price Parities (19 Feb 2026), Real Personal Income for States · US Census Bureau, 2020 Census urban and rural (Dec 2022), P60-289, P60-291, ACS Brief 24 · BLS, CPI (Sep 2026), Employment Situation (Sep 2026), Consumer Expenditure Survey 2024 · Congressional Research Service, R48945 · Harvard Joint Center for Housing Studies, State of the Nation’s Housing 2026 · HRSA, Designated HPSA Quarterly Summary (30 Jun 2026); State of the Behavioral Health Workforce (Dec 2025) · WWAMI Rural Health Research Center, behavioral health workforce data briefs (2025 to 2026) · Mental Health America, State of Mental Health in America 2025 · Peterson-KFF Health System Tracker (Jun 2023) · Gao and Olfson, Psychiatric Services (2024) · RTI International (2025) · Fujita, Parish and Mark, Psychiatric Services (2025) · Ridley, Rao, Schilbach and Patel, NBER WP 27157 / Science (2020) · Picchio and Ubaldi, Journal of Economic Surveys (2023) · Johns Hopkins Bloomberg School of Public Health (Jul 2024) †
Full source list: every figure with its publisher, release date and link (98 entries)
| ID | Figure | Publisher | Release | Link |
|---|---|---|---|---|
| S1 | Regional price parities, all items and housing, by state | BEA (SARPP) | 2024; released 19 Feb 2026; next release 10 Dec 2026 | Source · Link 2 |
| S2 | Real per-capita personal income (constant 2017 dollars, RPP-adjusted) | BEA (SARPI) | 2024 | Source · Link 2 |
| S3 | Ever told depressive disorder; poor mental health days; loneliness (optional module) | CDC BRFSS Mental Health Indicators | 2024 | Source |
| S4 | Any mental illness (Table 33, 2023-24), major depressive episode (Table 38, 2023-24), mental health treatment (Table 37, 2024), adults 18+, by state | SAMHSA, 2023-2024 NSDUH state prevalence estimates | 2023-2024 | Source |
| S5 | Urban share of state population (aggregated from county urban/rural file) | US Census Bureau, 2020 Census urban and rural | 2020 | Source · Link 2 |
| S6 | Correlations, partial correlations, bootstrap ranges | CostLiving | PDF on file | |
| N01 | Any mental illness 20.6% (54.6 million); 18-25 28.6%, 26-49 27.1%, 50+ 12.8% | SAMHSA, 2025 NSDUH Annual National Report (Jul 2026) | 2025 | Source |
| N02 | Serious mental illness 6.9% (18.2 million) | SAMHSA, 2025 NSDUH Annual National Report (Jul 2026) | 2025 | Source |
| N03 | Major depressive episode 7.4% (19.7 million); 8.5% in 2021, decreased; 18-25 14.2%, 50+ 4.0% | SAMHSA, 2025 NSDUH Annual National Report (Jul 2026) | 2025 | Source |
| N04 | MDE with severe impairment 5.2% (13.8 million) | SAMHSA, 2025 NSDUH Annual National Report (Jul 2026) | 2025 | Source |
| N05 | Adolescent MDE 15.1% (3.7 million), 20.8% in 2021 | SAMHSA, 2025 NSDUH Annual National Report (Jul 2026) | 2025 | Source |
| N06 | GAD-7 moderate or severe symptoms: adults 6.6% (17.5 million); adolescents 18.0% | SAMHSA, 2025 NSDUH Annual National Report (Jul 2026) | 2025 | Source |
| N07 | Treatment received: AMI adults 50.9%; SMI 67.7%; MDE 65.9%; adolescents 27.6% (all) and 57.7% (with MDE) | SAMHSA, 2025 NSDUH Annual National Report (Jul 2026) | 2025 | Source |
| N08 | AMI restated 2024 under new model 21.5% (23.4% under old model); 2021-25 series 21.0, 21.3, 20.9, 21.5, 20.6 | SAMHSA, 2025 NSDUH Annual National Report (Jul 2026) | 2025 | Source |
| A15 | 13.1% had depression in a 2-week period (up from 8.2% in 2013-14) | CDC NCHS Data Brief 527 | Aug 2021 to Aug 2023 (trend base 2013-14) | Source |
| A16 | Depression by sex: females 16.0%, males 10.1% | CDC NCHS Data Brief 527 | Aug 2021 to Aug 2023 | same as A15 |
| A17 | Depression by age: 19.2% (12-19) down to 8.7% (60+); adolescent females 26.5% vs males 12.2% | CDC NCHS Data Brief 527 | Aug 2021 to Aug 2023 | same as A15 |
| A18 | Depression by income: 22.1% below the poverty line vs 7.4% at 400%+ of the poverty level | CDC NCHS Data Brief 527 | Aug 2021 to Aug 2023 | same as A15 |
| A19 | 39.3% of people with depression received counselling or therapy in the past 12 months (females 43.0%, males 33.2%) | CDC NCHS Data Brief 527 | Aug 2021 to Aug 2023 | same as A15 |
| A20 | 19.1% of adults currently have or are being treated for depression (Q1 2026); peak 20.0% in Q4 2025; 17.4% low in Q2 2024 | Gallup | 18 Feb to 3 Mar 2026 | Source |
| A21 | Lifetime diagnosed depression 29.5% (19.6% in 2015) | Gallup | 18 Feb to 3 Mar 2026 | same as A20 |
| A22 | Gallup current depression by age and income, 2026: 28.0% (18-29, from 13.0% in 2017), 9.8% (65+); 37.4% under $24,000 household income (22.1% in 2017) vs 15.8% at $120,000+; women 23.1%, men 14.6% | Gallup | 2017 vs Q1 2026 | same as A20 |
| A23 | Pre-COVID rise: Gallup depression climbed sharply from Q3 2019 to 19.2% in Q2 2023 | Gallup | Q3 2019 to Q2 2023 | same as A20 |
| A24 | 20% of US adults experienced a lot of loneliness “yesterday” (Feb 2026); 23% average in 2020 to early 2021; 17-18% through 2022-2024 | Gallup | Feb 2020 to Feb 2026 | same as A20 |
| A25 | 15.6% of adults had frequent mental distress | America’s Health Rankings (United Health Foundation), citing CDC BRFSS | 2024 | Source |
| A26 | 22.0% of adults ever told by a health professional they have a depressive disorder | America’s Health Rankings, citing CDC BRFSS | 2024 | Source |
| A27 | 12.5% of adults regularly had feelings of worry, nervousness or anxiety; 4.5% regularly had feelings of depression | CDC NCHS (NHIS Early Release) via FastStats | 2025 | Source |
| A29 | 40% of high school students had persistent feelings of sadness or hopelessness (42% in 2021); 53% of girls (57% in 2021) | CDC Youth Risk Behavior Survey | 2023 | Source |
| A30 | 10% of adults skipped mental health care or counselling because of cost | Federal Reserve Board, SHED | 2025 survey (report May 2026) | Source |
| A31 | 21% of adults felt depressed and 21% felt lonely “always” or “often”; about a third anxious; 52% of under-30s anxious; income under $40,000 vs $90,000+: lonely 30% v 11%, depressed 29% v 13%, anxious 39% v 29% | KFF/CNN Mental Health in America survey | 28 Jul to 9 Aug 2022 | Source |
| B01 | 63% could cover a $400 emergency expense with cash or equivalent | Federal Reserve Board, SHED (13th annual) | Fielded 17-28 Oct 2025; report released 13 May 2026 | Source · Link 2 |
| B02 | 73% doing at least okay financially | Federal Reserve Board, SHED | Oct 2025 | Source |
| B03 | 58% say price changes made their finances worse | Federal Reserve Board, SHED | Oct 2025 | Source |
| B04 | 28% struggled to pay bills in the prior month (16% did not pay all bills in full) | Federal Reserve Board, SHED | Month before Oct 2025 survey | Source |
| B05 | 59% had at least one major unexpected expense in 12 months | Federal Reserve Board, SHED | 12 months to Oct 2025 | Source |
| B06 | 23% of renters behind on rent at some point in past year | Federal Reserve Board, SHED | 12 months to Oct 2025 | Source |
| B07 | 42% say finding or keeping a job is a minor or major concern (37% in 2024); 90%+ say the same of price increases | Federal Reserve Board, SHED | Oct 2025 | Source |
| B08 | 26% skipped medical care because of cost (28% prior year) | Federal Reserve Board, SHED | 12 months to Oct 2025 | Source |
| B09 | 77% cite cost of living as a significant source of stress | American Psychological Association, Stress in America 2026 | 29 Jul-24 Aug 2026; published Oct 2026 | Source |
| B10 | 59% felt they were doing everything right but still falling behind | APA, Stress in America 2026 | 29 Jul-24 Aug 2026 | Source |
| B11 | 56% had to lower their expectations for what they could achieve in life | APA, Stress in America 2026 | 29 Jul-24 Aug 2026 | Source |
| B12 | 19.1% currently have or are being treated for depression (series high 20.0% in Q4 2025) | Gallup | 18 Feb-3 Mar 2026 (Q1 2026) | Source |
| B13 | Depression rate by household income: under $24,000 = 37.4% (22.1% in 2017); $24,000-47,999 = 24.8%; $48,000-89,999 = 17.9%; $90,000-120,000 = 15.6%; $120,000+ = 15.8% | Gallup | Q1 2026 vs 2017 | Source |
| B14 | PHQ-9 depression prevalence by family income: below 100% of poverty line 22.1%; 100-<200% 19.2%; 200-<400% 13.1%; 400%+ 7.4% (overall US 13.1%) | CDC NCHS Data Brief 527 | Aug 2021-Aug 2023 | Source |
| B15 | Past-year medical debt: 27.3% among adults with current depression vs 9.4% without; 26.2% with current anxiety vs 9.6% without | Johns Hopkins Bloomberg School of Public Health (summary of the JAMA Psychiatry paper) | NHIS 2022 | Source |
| B16 | Poverty-alleviation RCT meta-analysis: pooled effect of 0.094 SD (95% CI 0.040-0.147) on mental health; cash transfers 0.067 SD; multi-faceted programmes 0.138 SD | NBER / Science | Working paper May 2020 (rev. Nov 2020) | Source · Link 2 · Link 3 |
| B17 | Unemployment and mental health: average partial correlation about -0.048 (all health outcomes about -0.033) | Journal of Economic Surveys (Wiley); PDF from the University of Marche repository | Studies 1990-2021 | Source |
| B18 | 47% worry they will not be able to afford necessary healthcare in the coming year (record since 2021) | Gallup (West Health-Gallup) | 9 Jun-25 Aug 2025 | Source |
| B19 | Nearly half of renter households cost-burdened in 2024; cost burdens at a new record for renters and worse for owners | Harvard Joint Center for Housing Studies (via Harvard GSD summary) | 2024 data | Source · Link 2 |
| B20 | 22.7 million renter households (49.4%) and 20.7 million owner households (23.9%) cost-burdened; 26.2% of renter households severely cost-burdened | Congressional Research Service, “Housing Cost Burdens in 2024: In Brief” (R48945), 13 May 2026 | 2024 ACS | Source |
| B21 | CPI-U all items +3.7% over 12 months to September 2026 | BLS | September 2026; released 14 Oct 2026 (October CPI due in November and will supersede) | Source |
| B23 | Average annual expenditure $78,535 per consumer unit in 2024; average pre-tax income $104,207 | BLS Consumer Expenditure Survey | Calendar 2024; released 19 Dec 2025 | Source |
| B25 | State regional price parities, 2024 (US = 100): highest California 110.7, Hawaii 110.0, DC 109.9, New Jersey 108.8; lowest Arkansas 86.9, Mississippi 87.0, Iowa 87.8, Oklahoma 87.8 | BEA | 2024; released 19 Feb 2026 (next release 10 Dec 2026) | Source |
| B26 | Real median household income $87,460 in 2025, up 2.6% from $85,210 in 2024; post-tax $76,060 | US Census Bureau, Income in the United States: 2025 (P60-289) | Calendar 2025; Sept 2026 | Source · Link 2 |
| B27 | US unemployment rate 4.2% | BLS | September 2026; released 2 Oct 2026 | Source |
| C01 | 20.6% of adults had any mental illness (AMI); 54.6 million. LATEST | SAMHSA, 2025 NSDUH Annual National Report (released 27 July 2026) | 2025 | Source |
| C02 | 50.9% of adults with AMI received any mental health treatment; 26.9 million (about 49%) did not. LATEST | SAMHSA, 2025 NSDUH | 2025 | Source |
| C03 | 21.4% of untreated adults with AMI (5.6 million) perceived an unmet need for treatment; 35.9% of untreated 18 to 25s. LATEST | SAMHSA, 2025 NSDUH | 2025 | Source |
| C04 | Cost: 61.4% of adults with AMI and a perceived unmet need said they thought treatment would cost too much (second most common reason after “handle it on my own”, 72.9%). LATEST | SAMHSA, 2025 NSDUH (p. 63, Table A.78B) | 2025 | Source |
| C05 | Insurance reasons: 40.3% said insurance did not pay enough of the costs; 39.0% had no insurance coverage for mental health treatment. 44.9% did not know how or where to get treatment; 43.2% could not find a professional they wanted. LATEST | SAMHSA, 2025 NSDUH (p. 63) | 2025 | Source |
| C06 | Serious mental illness (SMI): 18.2 million adults; 5.9 million (about one third) untreated; 40.5% of those untreated perceived an unmet need (2.3 million). LATEST | SAMHSA, 2025 NSDUH | 2025 | Source |
| C09 | 5.4% of adults did not get needed mental health care due to cost (5.6% Jan to Jun, 5.2% Jul to Dec). LATEST | CDC NCHS, NHIS Early Release of Selected Estimates, 2025 | Jan to Dec 2025 | Source |
| C10 | 14.0% of adults received counselling or therapy and 19.3% took mental health medication in 2024; nonmetropolitan adults least likely to get counselling (10.6%) versus large central metro (15.2%). LATEST published data brief for 2024 | CDC NCHS, Data Brief No. 564, “Mental Health Treatment Among Adults: United States, 2024” (June 2026) | 2024 | Source |
| C12 | 44% of insured adults who did not get needed mental health care said they could not afford it; 37% said insurance would not cover it; 43% of insured adults in fair or poor mental health had unmet need (Medicaid 44%, employer 46%, Marketplace 45%, Medicare 27%). | KFF (Drew Altman column) | Published 10 Dec 2024 | Source |
| C13 | 7,109 mental health HPSA designations; 157,149,246 people living in them (overlaps possible); 26.53% of need met; 7,825 practitioners needed. LATEST | HRSA, Designated HPSA Quarterly Summary | As of 30 June 2026 | Source |
| C15 | Rural split of mental health HPSAs: 4,295 rural designations (60.42%) covering 31.7 million people; 85.7 million people in partially rural HPSAs; 39.4 million in non-rural. | HRSA, Designated HPSA Quarterly Summary, Table 2 | As of 30 June 2026 | Source |
| C16 | US psychiatrists 17.7 per 100,000 (60,061); psychologists 38.7 per 100,000 (131,537). Urban 20.0 and 43.1; rural 5.7 and 15.9 (rural psychiatrist density under a third of urban). | WWAMI Rural Health Research Center, Univ. of Washington (federally funded) data briefs, Woolcock | NPPES January 2025; briefs dated 2025 to 2026 | Source |
| C17 | State rural v urban psychiatrists per 100,000: Vermont 24.9 rural / 56.2 urban; Alabama 3.6 / 13.0; Nevada 3.3 / 10.0; Texas 2.8 / 11.7. Psychologists: Vermont 75.6 / 152.2; Alabama 3.6 / 15.8; Nevada 7.9 / 25.0; Texas 4.9 / 18.7. | WWAMI RHRC state briefs | NPPES January 2025 | Source · Link 2 |
| C18 | Projected 2038 shortage (status quo): adult psychiatrists 36,780 FTE (50% of demand met); child and adolescent psychiatrists 7,030 (61%); psychologists 99,840 (48%); mental health counsellors 99,780 (55%). | HRSA National Center for Health Workforce Analysis, State of the Behavioral Health Workforce, 2025 | Published Dec 2025; projections to 2038 | Source |
| C19 | 45% of rural counties had no psychologist versus 16% of urban counties; 69% v 31% for psychiatric mental health nurse practitioners; 18% v 5% for counsellors. HRSA gives no rural/urban psychiatrist split. | HRSA NCHWA, as C18 (Table 3) | 2021 data | Source |
| C20 | 320 residents for every one mental health provider in the US. LATEST edition | Mental Health America, State of Mental Health in America 2025 | Data year 2024; report Sept 2025 | Source |
| C21 | MHA Access to Care ranking: best Vermont (1), Maine (2), Massachusetts (3); worst Alabama (51), Texas (50), South Carolina (49). Full 1 to 51 order available in the PDF (e.g. Oregon 7, New York 8, California 37, Florida 44, Georgia 46, Nevada 47). LATEST edition | Mental Health America | 2025 edition (published Sept 2025; no 2026 edition found) | Source · Link 2 |
| C23 | Average out-of-pocket cost per outpatient mental health office visit: $128 for psychiatric visits and $96 for other mental health visits; annual out-of-pocket $1,501 for people treated for depression or anxiety versus $863 with no mental health diagnosis; psychotherapy averaged $348 out of pocket a year. | Peterson-KFF Health System Tracker (KFF analysis of Merative MarketScan; not peer-reviewed) | 2021 claims; published 23 Jun 2023 | Source |
| C24 | Per-visit out-of-pocket cost averaged $117 for adults with a high mental health cost burden (OOP at least 10% of disposable income) versus $38 for the low-burden group; annual OOP $3,670 v $328. | Gao and Olfson, Psychiatric Services 76(2):200 to 203 | 2018 to 2021 (online 11 Sep 2024) | Source |
| C25 | Out-of-network use is far higher for mental health: patients went out of network 3.5 times more often for behavioural health clinicians, 8.9 times for psychiatrists, 10.6 times for psychologists, 6.2 times for acute behavioural inpatient care, versus medical/surgical care. | RTI International | 2019 to 2021 | Source |
| C26 | Peer-reviewed 2021 out-of-network shares: sub-acute inpatient 31.7% for mental disorders v 1.7% medical/surgical; acute inpatient 4.3% v 1.5%. | Mark, Parish and Fujita, Psychiatric Services (via Psychiatric News summary and journal page) | 2021 | Source · Link 2 |
| C27 | Facilities accepting insurance: 83% of mental health treatment facilities participate with private insurance, 85% with Medicaid, 64% with Medicare (participation does not mean accepting new patients). | KFF analysis of SAMHSA N-SUMHSS | 2024 | Source |
| C28 | Medicaid covers nearly one third of all adults with mental illness and nearly a quarter of adults with substance use disorder. | KFF | Published 13 May 2026 | Source |
| C29 | 26.7 million people (7.9%) uninsured for the entire year; Medicaid covered 17.1% for some or all of the year (down 0.5 points). LATEST national | US Census Bureau, P60-291 | Calendar 2025 (published 15 Sep 2026) | Source |
| C31 | State uninsured rates (ACS): national 8.2% in 2024, up from 7.9%; lowest Massachusetts 2.8%, highest Texas 16.7%. LATEST state-level (2025 ACS state estimates not yet found; Census says ACS 1-year health insurance estimates come in October 2026) | US Census Bureau, ACS Brief ACSBR-024 | 2024 | Source |
| C32 | Telehealth: 32.8% of adults with AMI (17.9 million) received mental health treatment via telehealth in 2025; 34.2% received outpatient treatment; 39.5% took prescription medication. | SAMHSA, 2025 NSDUH | 2025 | Source |
| D01 | West Virginia: 30.2% (95% CI 28.7-31.7) ever told they have a depressive disorder | CDC, BRFSS Mental Health Indicators (data.cdc.gov 5eh7-pjx8) | 2024 | Source |
| D02 | Kentucky: 28.3% (26.8-29.8) ever told they have a depressive disorder | As D01 | 2024 | Source |
| D03 | New Jersey: 13.3% (12.3-14.3) ever told they have a depressive disorder | As D01 | 2024 | Source |
| D04 | Hawaii: 14.4% (13.2-15.6) ever told they have a depressive disorder | As D01 | 2024 | Source |
| D05 | Mental health not good, same four states, 2024: WV 19.3% (18.0-20.7); KY 18.4% (17.1-19.7); NJ 13.2% (12.3-14.2); HI 12.6% (11.5-13.8). NOTE: the dataset question text says only “for how many days during the past 30 days was your mental health not good?”. The “14 or more days” threshold is NOT stated in the dataset record or its metadata, so the threshold behind these percentages is unconfirmed from this source (see Section B). | As D01 | 2024 | Source |
| D06 | Dataset has 12 columns (Year, Question, Area, … Percent, CI low/high, Data_Label, Percentile_Range), Percent “rounded to 1 decimal place”, 95% CI; the record has no methodology section and says nationwide estimates are not available. The record does not say whether Percent is crude or age-adjusted. | CDC, Mental Health Data Channel | 2022 onward (2024 latest seen) | Source |
| D07 | BRFSS is a telephone survey, all 50 states, DC and three territories; 2024 data continue raking-based weighting introduced in 2011; Tennessee did not collect enough data for the 2024 public file | CDC BRFSS | 2024 | Source |
| D08 | Median 2024 BRFSS survey response rate 43.9% (range 30.7% to 64.8%); lowest combined rate Idaho 30.7%, then Connecticut 31.8% | CDC BRFSS, 2024 Summary Data Quality Report | 2024 | Source |
| D09 | 2024 BRFSS weighting and mode: CATI telephone, landline plus cell; weights are design weight plus demographic adjustment by iterative proportional fitting (raking); in 2024 raking expanded to include education, marital status and regional categories | CDC BRFSS, 2024 Overview | 2024 | Source |
| D10 | Rural/urban definition: urban areas hold 80.0% of US population in 2020 (80.7% in 2010); rural share 20.0% (19.3% in 2010). Rural = everything outside urban areas. Urban generally needs at least 5,000 people or 2,000 housing units. | US Census Bureau | 2020 Census | Source |
| D11 | Most rural state in 2020: Vermont, 64.9% of population rural; most urban: California 94.2%, Nevada 94.1% | US Census Bureau | 2020 Census | Source |
| D14 | Depression, BRFSS ever told, nonmetro vs metro adults: 22.3% rural vs 19.8% metropolitan in 2023 (ratio 1.13); 2021 to 2023 rural 21.5% to 22.3%, metro 19.2% to 19.8%. “Rural” here means BRFSS nonmetropolitan (micropolitan plus noncore). Correlational. | America’s Health Rankings analysis of CDC BRFSS | 2021-2023 | Source |
| D15 | Nonmetro US depression 23.5% (BRFSS 2024); all-adult US value 22.0%. Metro figure not shown on page. | America’s Health Rankings, CDC BRFSS | 2024 | Source |
| D26 | NSDUH major depressive episode (MDE) definition: at least one 2-week period in the past year of depressed mood or loss of interest nearly every day, plus problems with sleeping, eating, energy, concentration, self-worth or recurrent thoughts of death (DSM-5 criteria, five or more symptoms in the same 2 weeks); adult and adolescent wording differs so not directly comparable | SAMHSA NSDUH 2024 Annual National Report | 2024 | (same URL as D25) |
| D27 | NSDUH state estimates are model-based: survey-weighted hierarchical Bayes small area estimation (used since 1999 surveys), mixed logistic regression with outside covariates (Census, ACS, crime, BLS, BEA, NCHS mortality, treatment facility data); state estimates are benchmarked so the population-weighted mean of the 50 states plus DC equals the design-based national estimate; large-sample states are close to direct estimates, small-sample states borrow strength so can differ; most state estimates pool two years (2023-2024) | SAMHSA, 2024 NSDUH SAE Guide to State Tables | 2023-2024 | Source |
| D28 | NSDUH state-estimate cautions: rank order does not imply a significant difference from the nearest state; significantly different estimates can have overlapping CIs; do not compare 2021-22 to 2023-24 state estimates with 2020 or earlier because multimode data collection changed results | SAMHSA, 2024 NSDUH SAE Guide | 2023-2024 | same as D27 |
| D29 | SAMHSA state prevalence report: 41 tables, 2023-2024 NSDUH, adults 18+ for mental health measures, civilian non-institutionalised population, 95% intervals | SAMHSA | 2023-2024 | Source |